Romanian vs Immigrants from Zimbabwe Married-Couple Family Poverty
COMPARE
Romanian
Immigrants from Zimbabwe
Married-Couple Family Poverty
Married-Couple Family Poverty Comparison
Romanians
Immigrants from Zimbabwe
4.8%
MARRIED-COUPLE FAMILY POVERTY
92.5/ 100
METRIC RATING
124th/ 347
METRIC RANK
4.3%
MARRIED-COUPLE FAMILY POVERTY
99.7/ 100
METRIC RATING
56th/ 347
METRIC RANK
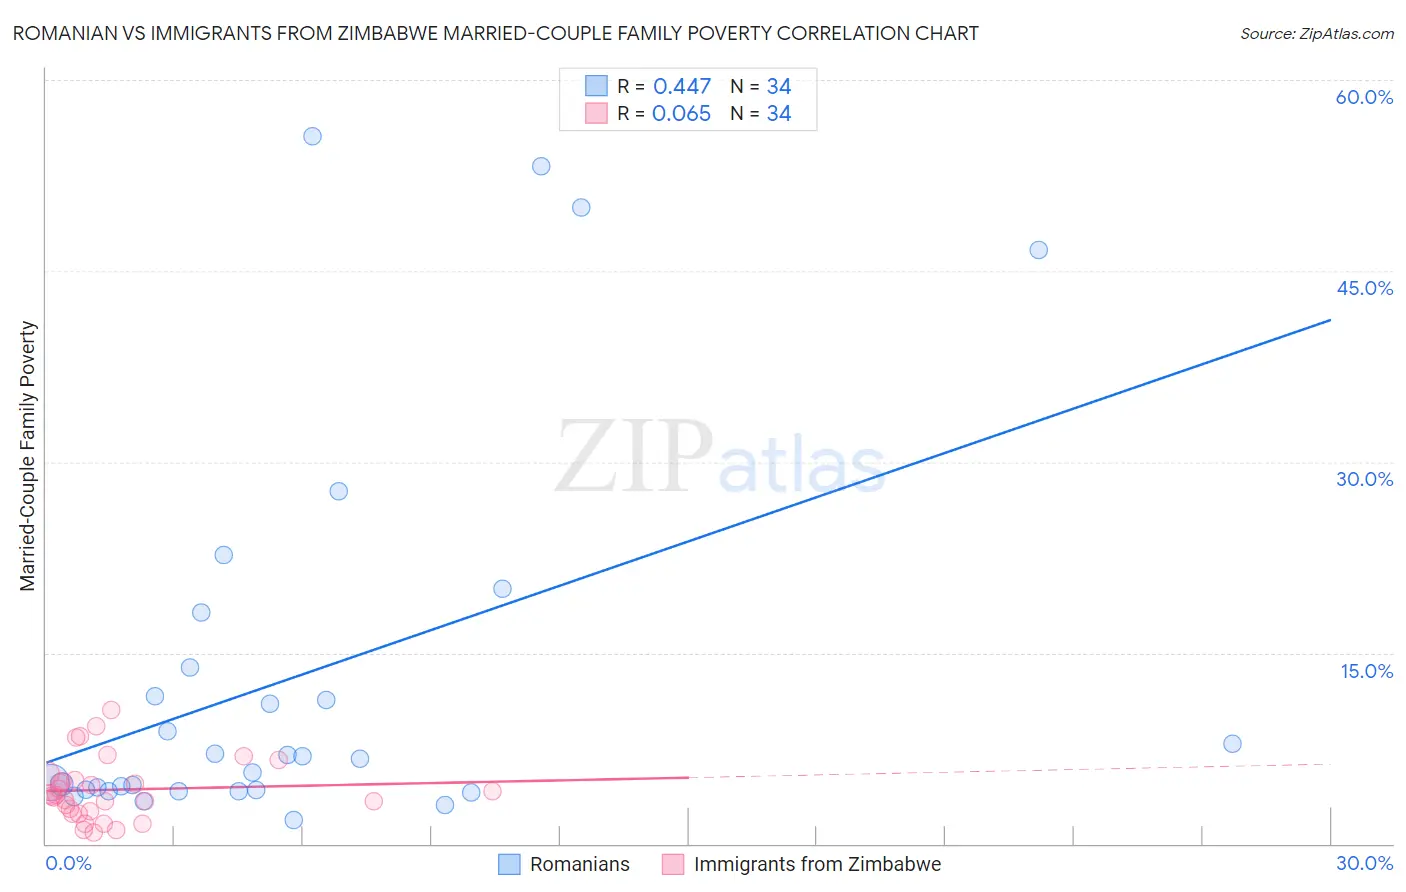
Romanian vs Immigrants from Zimbabwe Married-Couple Family Poverty Correlation Chart
The statistical analysis conducted on geographies consisting of 374,441,854 people shows a moderate positive correlation between the proportion of Romanians and poverty level among married-couple families in the United States with a correlation coefficient (R) of 0.447 and weighted average of 4.8%. Similarly, the statistical analysis conducted on geographies consisting of 117,574,773 people shows a slight positive correlation between the proportion of Immigrants from Zimbabwe and poverty level among married-couple families in the United States with a correlation coefficient (R) of 0.065 and weighted average of 4.3%, a difference of 11.3%.
Married-Couple Family Poverty Correlation Summary
| Measurement | Romanian | Immigrants from Zimbabwe |
| Minimum | 1.9% | 0.84% |
| Maximum | 55.6% | 10.5% |
| Range | 53.6% | 9.7% |
| Mean | 13.3% | 4.3% |
| Median | 6.8% | 3.8% |
| Interquartile 25% (IQ1) | 4.2% | 2.6% |
| Interquartile 75% (IQ3) | 13.9% | 5.0% |
| Interquartile Range (IQR) | 9.6% | 2.5% |
| Standard Deviation (Sample) | 15.4% | 2.4% |
| Standard Deviation (Population) | 15.1% | 2.4% |
Similar Demographics by Married-Couple Family Poverty
Demographics Similar to Romanians by Married-Couple Family Poverty
In terms of married-couple family poverty, the demographic groups most similar to Romanians are Immigrants from Bosnia and Herzegovina (4.8%, a difference of 0.020%), Immigrants from Asia (4.8%, a difference of 0.090%), Egyptian (4.8%, a difference of 0.23%), Jordanian (4.8%, a difference of 0.27%), and White/Caucasian (4.8%, a difference of 0.29%).
| Demographics | Rating | Rank | Married-Couple Family Poverty |
| Kenyans | 94.7 /100 | #117 | Exceptional 4.8% |
| Immigrants | Philippines | 94.6 /100 | #118 | Exceptional 4.8% |
| Immigrants | Eastern Asia | 94.0 /100 | #119 | Exceptional 4.8% |
| Immigrants | Southern Europe | 93.4 /100 | #120 | Exceptional 4.8% |
| Indians (Asian) | 93.2 /100 | #121 | Exceptional 4.8% |
| Whites/Caucasians | 93.1 /100 | #122 | Exceptional 4.8% |
| Jordanians | 93.1 /100 | #123 | Exceptional 4.8% |
| Romanians | 92.5 /100 | #124 | Exceptional 4.8% |
| Immigrants | Bosnia and Herzegovina | 92.5 /100 | #125 | Exceptional 4.8% |
| Immigrants | Asia | 92.3 /100 | #126 | Exceptional 4.8% |
| Egyptians | 92.0 /100 | #127 | Exceptional 4.8% |
| Palestinians | 91.2 /100 | #128 | Exceptional 4.9% |
| Immigrants | Pakistan | 90.7 /100 | #129 | Exceptional 4.9% |
| Soviet Union | 90.7 /100 | #130 | Exceptional 4.9% |
| Immigrants | Eastern Europe | 90.5 /100 | #131 | Exceptional 4.9% |
Demographics Similar to Immigrants from Zimbabwe by Married-Couple Family Poverty
In terms of married-couple family poverty, the demographic groups most similar to Immigrants from Zimbabwe are Immigrants from Netherlands (4.3%, a difference of 0.0%), Czechoslovakian (4.4%, a difference of 0.090%), French (4.3%, a difference of 0.16%), Austrian (4.3%, a difference of 0.18%), and Welsh (4.3%, a difference of 0.44%).
| Demographics | Rating | Rank | Married-Couple Family Poverty |
| Turks | 99.7 /100 | #49 | Exceptional 4.3% |
| Burmese | 99.7 /100 | #50 | Exceptional 4.3% |
| Immigrants | Lithuania | 99.7 /100 | #51 | Exceptional 4.3% |
| Russians | 99.7 /100 | #52 | Exceptional 4.3% |
| Welsh | 99.7 /100 | #53 | Exceptional 4.3% |
| Austrians | 99.7 /100 | #54 | Exceptional 4.3% |
| French | 99.7 /100 | #55 | Exceptional 4.3% |
| Immigrants | Zimbabwe | 99.7 /100 | #56 | Exceptional 4.3% |
| Immigrants | Netherlands | 99.7 /100 | #57 | Exceptional 4.3% |
| Czechoslovakians | 99.7 /100 | #58 | Exceptional 4.4% |
| Immigrants | Sweden | 99.6 /100 | #59 | Exceptional 4.4% |
| Tlingit-Haida | 99.6 /100 | #60 | Exceptional 4.4% |
| Okinawans | 99.6 /100 | #61 | Exceptional 4.4% |
| Immigrants | Australia | 99.6 /100 | #62 | Exceptional 4.4% |
| Immigrants | Sri Lanka | 99.6 /100 | #63 | Exceptional 4.4% |