Romanian Self-Care Disability
COMPARE
Romanian
Select to Compare
Self-Care Disability
Romanian Self-Care Disability
2.4%
SELF-CARE DISABILITY
75.8/ 100
METRIC RATING
148th/ 347
METRIC RANK
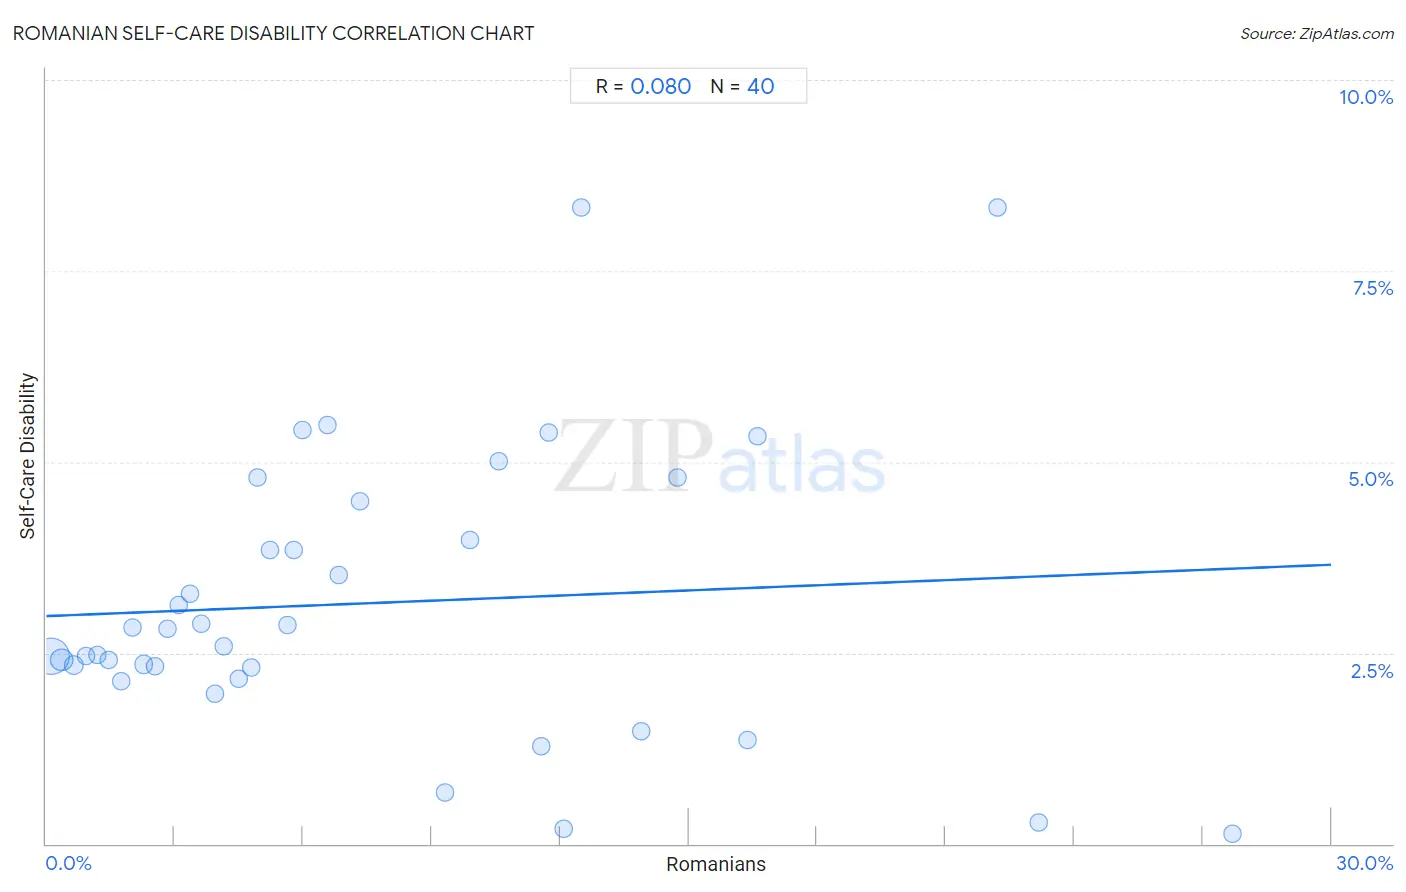
Romanian Self-Care Disability Correlation Chart
The statistical analysis conducted on geographies consisting of 377,466,974 people shows a slight positive correlation between the proportion of Romanians and percentage of population with self-care disability in the United States with a correlation coefficient (R) of 0.080 and weighted average of 2.4%. On average, for every 1% (one percent) increase in Romanians within a typical geography, there is an increase of 0.022% in percentage of population with self-care disability.
It is essential to understand that the correlation between the percentage of Romanians and percentage of population with self-care disability does not imply a direct cause-and-effect relationship. It remains uncertain whether the presence of Romanians influences an upward or downward trend in the level of percentage of population with self-care disability within an area, or if Romanians simply ended up residing in those areas with higher or lower levels of percentage of population with self-care disability due to other factors.
Demographics Similar to Romanians by Self-Care Disability
In terms of self-care disability, the demographic groups most similar to Romanians are Arab (2.4%, a difference of 0.010%), Immigrants from Costa Rica (2.4%, a difference of 0.050%), Dutch (2.4%, a difference of 0.11%), Basque (2.4%, a difference of 0.12%), and Tlingit-Haida (2.4%, a difference of 0.15%).
| Demographics | Rating | Rank | Self-Care Disability |
| Alaska Natives | 84.5 /100 | #141 | Excellent 2.4% |
| Immigrants from Peru | 83.2 /100 | #142 | Excellent 2.4% |
| Afghans | 82.3 /100 | #143 | Excellent 2.4% |
| Costa Ricans | 80.8 /100 | #144 | Excellent 2.4% |
| Germans | 80.1 /100 | #145 | Excellent 2.4% |
| Israelis | 80.0 /100 | #146 | Good 2.4% |
| Dutch | 77.5 /100 | #147 | Good 2.4% |
| Romanians | 75.8 /100 | #148 | Good 2.4% |
| Arabs | 75.7 /100 | #149 | Good 2.4% |
| Immigrants from Costa Rica | 75.1 /100 | #150 | Good 2.4% |
| Basques | 74.0 /100 | #151 | Good 2.4% |
| Tlingit-Haida | 73.5 /100 | #152 | Good 2.4% |
| Immigrants from England | 73.5 /100 | #153 | Good 2.4% |
| Italians | 72.2 /100 | #154 | Good 2.4% |
| Pakistanis | 71.4 /100 | #155 | Good 2.4% |
Romanian Self-Care Disability Correlation Summary
| Measurement | Romanian Data | Self-Care Disability Data |
| Minimum | 0.10% | 0.12% |
| Maximum | 27.7% | 8.3% |
| Range | 27.6% | 8.2% |
| Mean | 7.6% | 3.2% |
| Median | 5.4% | 2.7% |
| Interquartile 25% (IQ1) | 2.7% | 2.2% |
| Interquartile 75% (IQ3) | 11.6% | 4.2% |
| Interquartile Range (IQR) | 9.0% | 2.0% |
| Standard Deviation (Sample) | 6.7% | 1.9% |
| Standard Deviation (Population) | 6.6% | 1.9% |
Correlation Details
| Romanian Percentile | Sample Size | Self-Care Disability |
[ 0.0% - 0.5% ] 0.10% | 284,371,983 | 2.5% |
[ 0.0% - 0.5% ] 0.36% | 62,578,181 | 2.4% |
[ 0.5% - 1.0% ] 0.66% | 15,520,925 | 2.3% |
[ 0.5% - 1.0% ] 0.93% | 7,441,973 | 2.5% |
[ 1.0% - 1.5% ] 1.19% | 3,338,433 | 2.5% |
[ 1.0% - 1.5% ] 1.46% | 1,431,529 | 2.4% |
[ 1.5% - 2.0% ] 1.75% | 919,566 | 2.1% |
[ 2.0% - 2.5% ] 2.02% | 580,295 | 2.8% |
[ 2.0% - 2.5% ] 2.28% | 336,618 | 2.3% |
[ 2.5% - 3.0% ] 2.53% | 297,050 | 2.3% |
[ 2.5% - 3.0% ] 2.82% | 213,648 | 2.8% |
[ 3.0% - 3.5% ] 3.09% | 38,760 | 3.1% |
[ 3.0% - 3.5% ] 3.35% | 120,022 | 3.3% |
[ 3.5% - 4.0% ] 3.63% | 85,013 | 2.9% |
[ 3.5% - 4.0% ] 3.93% | 57,344 | 2.0% |
[ 4.0% - 4.5% ] 4.13% | 65,676 | 2.6% |
[ 4.0% - 4.5% ] 4.49% | 7,647 | 2.2% |
[ 4.5% - 5.0% ] 4.80% | 2,397 | 2.3% |
[ 4.5% - 5.0% ] 4.93% | 3,630 | 4.8% |
[ 5.0% - 5.5% ] 5.22% | 6,517 | 3.8% |
[ 5.5% - 6.0% ] 5.62% | 2,527 | 2.9% |
[ 5.5% - 6.0% ] 5.79% | 16,133 | 3.8% |
[ 5.5% - 6.0% ] 5.97% | 4,205 | 5.4% |
[ 6.5% - 7.0% ] 6.55% | 4,212 | 5.5% |
[ 6.5% - 7.0% ] 6.84% | 3,858 | 3.5% |
[ 7.0% - 7.5% ] 7.32% | 164 | 4.5% |
[ 9.0% - 9.5% ] 9.30% | 1,990 | 0.67% |
[ 9.5% - 10.0% ] 9.90% | 3,586 | 4.0% |
[ 10.5% - 11.0% ] 10.55% | 673 | 5.0% |
[ 11.5% - 12.0% ] 11.56% | 5,501 | 1.3% |
[ 11.5% - 12.0% ] 11.74% | 426 | 5.4% |
[ 12.0% - 12.5% ] 12.10% | 1,885 | 0.20% |
[ 12.0% - 12.5% ] 12.50% | 24 | 8.3% |
[ 13.5% - 14.0% ] 13.88% | 353 | 1.5% |
[ 14.5% - 15.0% ] 14.75% | 278 | 4.8% |
[ 16.0% - 16.5% ] 16.36% | 220 | 1.4% |
[ 16.5% - 17.0% ] 16.61% | 319 | 5.3% |
[ 22.0% - 22.5% ] 22.22% | 783 | 8.3% |
[ 23.0% - 23.5% ] 23.18% | 962 | 0.28% |
[ 27.5% - 28.0% ] 27.70% | 1,668 | 0.12% |