Romanian Disability
COMPARE
Romanian
Select to Compare
Disability
Romanian Disability
11.6%
DISABILITY
72.7/ 100
METRIC RATING
150th/ 347
METRIC RANK
Romanian Disability Correlation Chart
The statistical analysis conducted on geographies consisting of 377,888,104 people shows a moderate positive correlation between the proportion of Romanians and percentage of population with a disability in the United States with a correlation coefficient (R) of 0.455 and weighted average of 11.6%. On average, for every 1% (one percent) increase in Romanians within a typical geography, there is an increase of 0.31% in percentage of population with a disability.
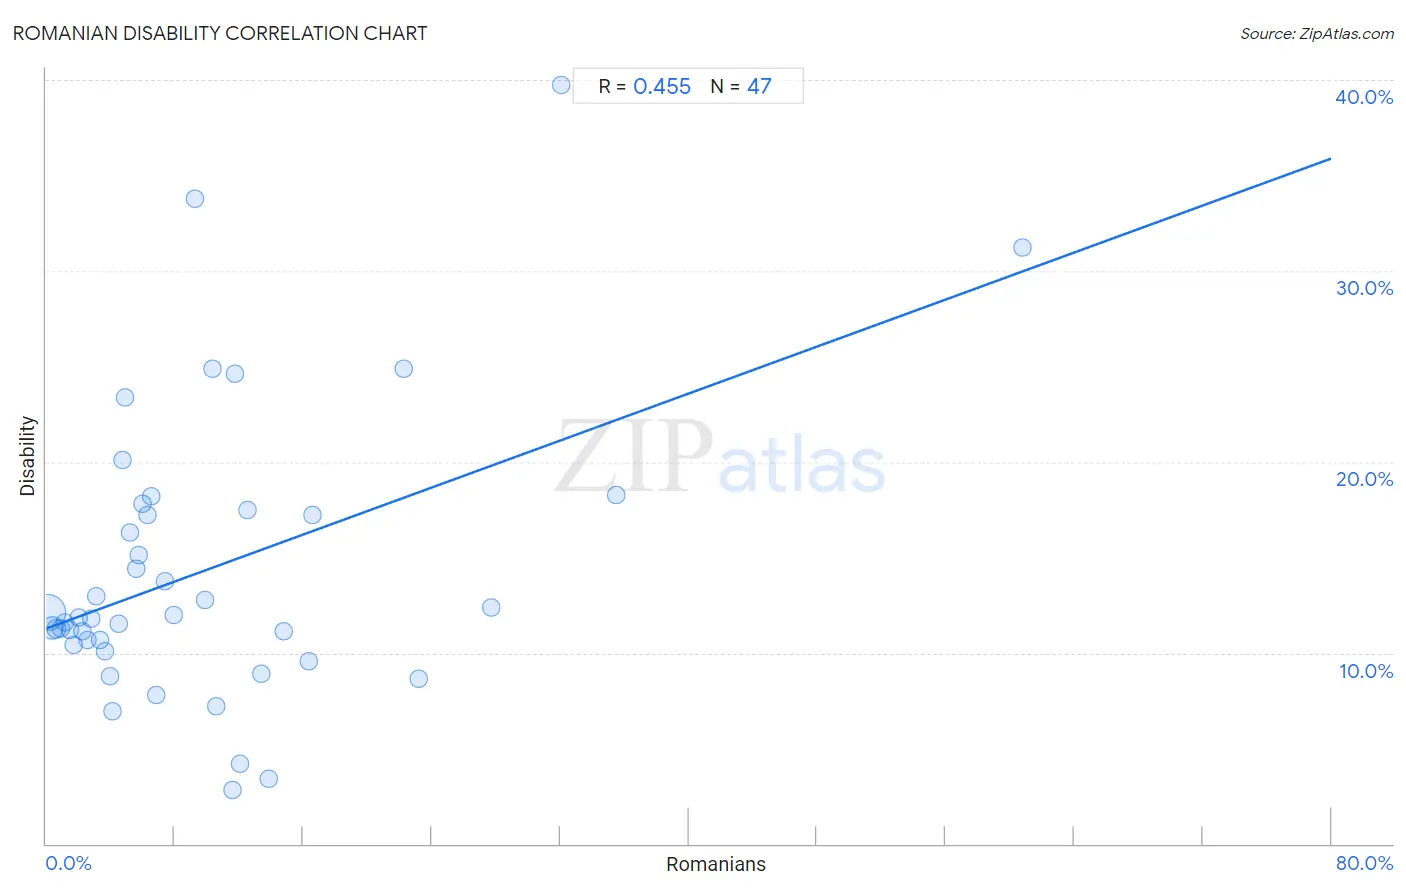
It is essential to understand that the correlation between the percentage of Romanians and percentage of population with a disability does not imply a direct cause-and-effect relationship. It remains uncertain whether the presence of Romanians influences an upward or downward trend in the level of percentage of population with a disability within an area, or if Romanians simply ended up residing in those areas with higher or lower levels of percentage of population with a disability due to other factors.
Demographics Similar to Romanians by Disability
In terms of disability, the demographic groups most similar to Romanians are Immigrants from Norway (11.6%, a difference of 0.030%), Immigrants from Kenya (11.6%, a difference of 0.030%), Immigrants from Moldova (11.6%, a difference of 0.040%), Immigrants from Ghana (11.6%, a difference of 0.080%), and Immigrants from Guatemala (11.6%, a difference of 0.080%).
| Demographics | Rating | Rank | Disability |
| Moroccans | 83.3 /100 | #143 | Excellent 11.5% |
| Australians | 82.5 /100 | #144 | Excellent 11.5% |
| Nigerians | 81.3 /100 | #145 | Excellent 11.5% |
| Immigrants from Hungary | 79.0 /100 | #146 | Good 11.5% |
| Immigrants from Ukraine | 77.6 /100 | #147 | Good 11.5% |
| Sudanese | 77.1 /100 | #148 | Good 11.5% |
| Immigrants from Norway | 73.2 /100 | #149 | Good 11.6% |
| Romanians | 72.7 /100 | #150 | Good 11.6% |
| Immigrants from Kenya | 72.1 /100 | #151 | Good 11.6% |
| Immigrants from Moldova | 72.0 /100 | #152 | Good 11.6% |
| Immigrants from Ghana | 71.2 /100 | #153 | Good 11.6% |
| Immigrants from Guatemala | 71.1 /100 | #154 | Good 11.6% |
| Immigrants from Netherlands | 69.8 /100 | #155 | Good 11.6% |
| Immigrants from Fiji | 69.5 /100 | #156 | Good 11.6% |
| Immigrants from Middle Africa | 69.5 /100 | #157 | Good 11.6% |
Romanian Disability Correlation Summary
| Measurement | Romanian Data | Disability Data |
| Minimum | 0.10% | 2.8% |
| Maximum | 60.8% | 39.7% |
| Range | 60.7% | 36.9% |
| Mean | 10.0% | 14.4% |
| Median | 6.3% | 11.9% |
| Interquartile 25% (IQ1) | 3.1% | 10.4% |
| Interquartile 75% (IQ3) | 12.5% | 17.5% |
| Interquartile Range (IQR) | 9.4% | 7.1% |
| Standard Deviation (Sample) | 11.1% | 7.5% |
| Standard Deviation (Population) | 11.0% | 7.5% |
Correlation Details
| Romanian Percentile | Sample Size | Disability |
[ 0.0% - 0.5% ] 0.10% | 284,548,895 | 12.1% |
[ 0.0% - 0.5% ] 0.36% | 62,694,724 | 11.3% |
[ 0.5% - 1.0% ] 0.66% | 15,572,227 | 11.3% |
[ 0.5% - 1.0% ] 0.93% | 7,459,596 | 11.3% |
[ 1.0% - 1.5% ] 1.19% | 3,348,367 | 11.6% |
[ 1.0% - 1.5% ] 1.46% | 1,442,105 | 11.2% |
[ 1.5% - 2.0% ] 1.75% | 927,791 | 10.4% |
[ 2.0% - 2.5% ] 2.02% | 583,206 | 11.9% |
[ 2.0% - 2.5% ] 2.28% | 341,552 | 11.2% |
[ 2.5% - 3.0% ] 2.53% | 297,832 | 10.6% |
[ 2.5% - 3.0% ] 2.82% | 216,524 | 11.8% |
[ 3.0% - 3.5% ] 3.09% | 39,247 | 13.0% |
[ 3.0% - 3.5% ] 3.35% | 120,201 | 10.7% |
[ 3.5% - 4.0% ] 3.63% | 85,739 | 10.1% |
[ 3.5% - 4.0% ] 3.94% | 64,919 | 8.8% |
[ 4.0% - 4.5% ] 4.13% | 65,774 | 6.9% |
[ 4.0% - 4.5% ] 4.49% | 7,647 | 11.5% |
[ 4.5% - 5.0% ] 4.78% | 3,368 | 20.1% |
[ 4.5% - 5.0% ] 4.93% | 4,057 | 23.3% |
[ 5.0% - 5.5% ] 5.22% | 7,065 | 16.3% |
[ 5.5% - 6.0% ] 5.58% | 3,603 | 14.4% |
[ 5.5% - 6.0% ] 5.79% | 18,526 | 15.1% |
[ 5.5% - 6.0% ] 5.97% | 4,839 | 17.8% |
[ 6.0% - 6.5% ] 6.30% | 540 | 17.2% |
[ 6.5% - 7.0% ] 6.57% | 4,903 | 18.2% |
[ 6.5% - 7.0% ] 6.84% | 3,858 | 7.8% |
[ 7.0% - 7.5% ] 7.41% | 378 | 13.8% |
[ 7.5% - 8.0% ] 7.98% | 326 | 12.0% |
[ 9.0% - 9.5% ] 9.30% | 1,990 | 33.8% |
[ 9.5% - 10.0% ] 9.90% | 3,586 | 12.8% |
[ 10.0% - 10.5% ] 10.32% | 659 | 24.9% |
[ 10.5% - 11.0% ] 10.55% | 919 | 7.2% |
[ 11.5% - 12.0% ] 11.56% | 5,501 | 2.8% |
[ 11.5% - 12.0% ] 11.74% | 426 | 24.6% |
[ 12.0% - 12.5% ] 12.10% | 1,885 | 4.2% |
[ 12.0% - 12.5% ] 12.50% | 40 | 17.5% |
[ 13.0% - 13.5% ] 13.36% | 247 | 8.9% |
[ 13.5% - 14.0% ] 13.88% | 353 | 3.4% |
[ 14.5% - 15.0% ] 14.75% | 278 | 11.2% |
[ 16.0% - 16.5% ] 16.36% | 220 | 9.5% |
[ 16.5% - 17.0% ] 16.61% | 319 | 17.2% |
[ 22.0% - 22.5% ] 22.22% | 783 | 24.9% |
[ 23.0% - 23.5% ] 23.18% | 962 | 8.6% |
[ 27.5% - 28.0% ] 27.70% | 1,668 | 12.3% |
[ 32.0% - 32.5% ] 32.05% | 78 | 39.7% |
[ 35.0% - 35.5% ] 35.48% | 93 | 18.3% |
[ 60.5% - 61.0% ] 60.76% | 288 | 31.2% |