Romanian 1 or more Vehicles in Household

COMPARE

Romanian
Race
Ancestry
AfghanAfricanAlaska NativeAlaskan AthabascanAlbanianAleutAlsatianAmericanApacheArabArapahoArgentineanArmenianAssyrian/Chaldean/SyriacAustralianAustrianBahamianBangladeshiBarbadianBasqueBelgianBelizeanBermudanBhutaneseBlackfeetBolivianBrazilianBritishBritish West IndianBulgarianBurmeseCajunCambodianCanadianCape VerdeanCarpatho RusynCelticCentral AmericanCentral American IndianCherokeeCheyenneChickasawChileanChineseChippewaChoctawColombianColvilleComancheCosta RicanCreeCreekCroatianCrowCubanCypriotCzechCzechoslovakianDanishDelawareDominicanDutchDutch West IndianEastern EuropeanEcuadorianEgyptianEnglishEstonianEthiopianEuropeanFijianFilipinoFinnishFrenchFrench American IndianFrench CanadianGermanGerman RussianGhanaianGreekGuamanian/ChamorroGuatemalanGuyaneseHaitianHmongHonduranHopiHoumaHungarianIcelanderIndian (Asian)IndonesianInupiatIranianIraqiIrishIroquoisIsraeliItalianJamaicanJapaneseJordanianKenyanKiowaKoreanLaotianLatvianLebaneseLiberianLithuanianLumbeeLuxembourgerMacedonianMalaysianMalteseMarshalleseMenomineeMexicanMexican American IndianMongolianMoroccanNative HawaiianNavajoNepaleseNew ZealanderNicaraguanNigerianNorthern EuropeanNorwegianOkinawanOsageOttawaPaiutePakistaniPalestinianPanamanianParaguayanPennsylvania GermanPeruvianPimaPolishPortuguesePotawatomiPuebloPuerto RicanPuget Sound SalishRomanianRussianSalvadoranSamoanScandinavianScotch-IrishScottishSeminoleSenegaleseSerbianShoshoneSierra LeoneanSiouxSlavicSlovakSloveneSomaliSouth AfricanSouth AmericanSouth American IndianSoviet UnionSpaniardSpanishSpanish AmericanSpanish American IndianSri LankanSubsaharan AfricanSudaneseSwedishSwissSyrianTaiwaneseThaiTlingit-HaidaTohono O'OdhamTonganTrinidadian and TobagonianTsimshianTurkishU.S. Virgin IslanderUgandanUkrainianUruguayanUteVenezuelanVietnameseWelshWest IndianYakamaYaquiYugoslavianYumanYup'ikZimbabwean
Immigration
NonimmigrantsImmigrantsAfghanistanAfricaAlbaniaArgentinaArmeniaAsiaAustraliaAustriaBahamasBangladeshBarbadosBelarusBelgiumBelizeBoliviaBosnia and HerzegovinaBrazilBulgariaBurma/MyanmarCabo VerdeCambodiaCameroonCanadaCaribbeanCentral AmericaChileChinaColombiaCongoCosta RicaCroatiaCubaCzechoslovakiaDenmarkDominicaDominican RepublicEastern AfricaEastern AsiaEastern EuropeEcuadorEgyptEl SalvadorEnglandEritreaEthiopiaEuropeFijiFranceGermanyGhanaGreeceGrenadaGuatemalaGuyanaHaitiHondurasHong KongHungaryIndiaIndonesiaIranIraqIrelandIsraelItalyJamaicaJapanJordanKazakhstanKenyaKoreaKuwaitLaosLatin AmericaLatviaLebanonLiberiaLithuaniaMalaysiaMexicoMicronesiaMiddle AfricaMoldovaMoroccoNepalNetherlandsNicaraguaNigeriaNorth AmericaNorth MacedoniaNorthern AfricaNorthern EuropeNorwayOceaniaPakistanPanamaPeruPhilippinesPolandPortugalRomaniaRussiaSaudi ArabiaScotlandSenegalSerbiaSierra LeoneSingaporeSomaliaSouth AfricaSouth AmericaSouth Central AsiaSouth Eastern AsiaSouthern EuropeSpainSri LankaSt. Vincent and the GrenadinesSudanSwedenSwitzerlandSyriaTaiwanThailandTrinidad and TobagoTurkeyUgandaUkraineUruguayUzbekistanVenezuelaVietnamWest IndiesWestern AfricaWestern AsiaWestern EuropeYemenZaireZimbabweAzores
Select to Compare
Race
Ancestry
AfghanAfricanAlaska NativeAlaskan AthabascanAlbanianAleutAlsatianAmericanApacheArabArapahoArgentineanArmenianAssyrian/Chaldean/SyriacAustralianAustrianBahamianBangladeshiBarbadianBasqueBelgianBelizeanBermudanBhutaneseBlackfeetBolivianBrazilianBritishBritish West IndianBulgarianBurmeseCajunCambodianCanadianCape VerdeanCarpatho RusynCelticCentral AmericanCentral American IndianCherokeeCheyenneChickasawChileanChineseChippewaChoctawColombianColvilleComancheCosta RicanCreeCreekCroatianCrowCubanCypriotCzechCzechoslovakianDanishDelawareDominicanDutchDutch West IndianEastern EuropeanEcuadorianEgyptianEnglishEstonianEthiopianEuropeanFijianFilipinoFinnishFrenchFrench American IndianFrench CanadianGermanGerman RussianGhanaianGreekGuamanian/ChamorroGuatemalanGuyaneseHaitianHmongHonduranHopiHoumaHungarianIcelanderIndian (Asian)IndonesianInupiatIranianIraqiIrishIroquoisIsraeliItalianJamaicanJapaneseJordanianKenyanKiowaKoreanLaotianLatvianLebaneseLiberianLithuanianLumbeeLuxembourgerMacedonianMalaysianMalteseMarshalleseMenomineeMexicanMexican American IndianMongolianMoroccanNative HawaiianNavajoNepaleseNew ZealanderNicaraguanNigerianNorthern EuropeanNorwegianOkinawanOsageOttawaPaiutePakistaniPalestinianPanamanianParaguayanPennsylvania GermanPeruvianPimaPolishPortuguesePotawatomiPuebloPuerto RicanPuget Sound SalishRussianSalvadoranSamoanScandinavianScotch-IrishScottishSeminoleSenegaleseSerbianShoshoneSierra LeoneanSiouxSlavicSlovakSloveneSomaliSouth AfricanSouth AmericanSouth American IndianSoviet UnionSpaniardSpanishSpanish AmericanSpanish American IndianSri LankanSubsaharan AfricanSudaneseSwedishSwissSyrianTaiwaneseThaiTlingit-HaidaTohono O'OdhamTonganTrinidadian and TobagonianTsimshianTurkishU.S. Virgin IslanderUgandanUkrainianUruguayanUteVenezuelanVietnameseWelshWest IndianYakamaYaquiYugoslavianYumanYup'ikZimbabwean
Immigration
NonimmigrantsImmigrantsAfghanistanAfricaAlbaniaArgentinaArmeniaAsiaAustraliaAustriaBahamasBangladeshBarbadosBelarusBelgiumBelizeBoliviaBosnia and HerzegovinaBrazilBulgariaBurma/MyanmarCabo VerdeCambodiaCameroonCanadaCaribbeanCentral AmericaChileChinaColombiaCongoCosta RicaCroatiaCubaCzechoslovakiaDenmarkDominicaDominican RepublicEastern AfricaEastern AsiaEastern EuropeEcuadorEgyptEl SalvadorEnglandEritreaEthiopiaEuropeFijiFranceGermanyGhanaGreeceGrenadaGuatemalaGuyanaHaitiHondurasHong KongHungaryIndiaIndonesiaIranIraqIrelandIsraelItalyJamaicaJapanJordanKazakhstanKenyaKoreaKuwaitLaosLatin AmericaLatviaLebanonLiberiaLithuaniaMalaysiaMexicoMicronesiaMiddle AfricaMoldovaMoroccoNepalNetherlandsNicaraguaNigeriaNorth AmericaNorth MacedoniaNorthern AfricaNorthern EuropeNorwayOceaniaPakistanPanamaPeruPhilippinesPolandPortugalRomaniaRussiaSaudi ArabiaScotlandSenegalSerbiaSierra LeoneSingaporeSomaliaSouth AfricaSouth AmericaSouth Central AsiaSouth Eastern AsiaSouthern EuropeSpainSri LankaSt. Vincent and the GrenadinesSudanSwedenSwitzerlandSyriaTaiwanThailandTrinidad and TobagoTurkeyUgandaUkraineUruguayUzbekistanVenezuelaVietnamWest IndiesWestern AfricaWestern AsiaWestern EuropeYemenZaireZimbabweAzores
1 or more Vehicles in Household
Income
Poverty
Unemployment
Labor Participation
Family Structure
Vehicle Availability
Education Level
Disability

Romanian 1 or more Vehicles in Household
Poor

89.2%
1+ VEHICLES AVAILABLE
18.2/ 100
METRIC RATING
204th/ 347
METRIC RANK

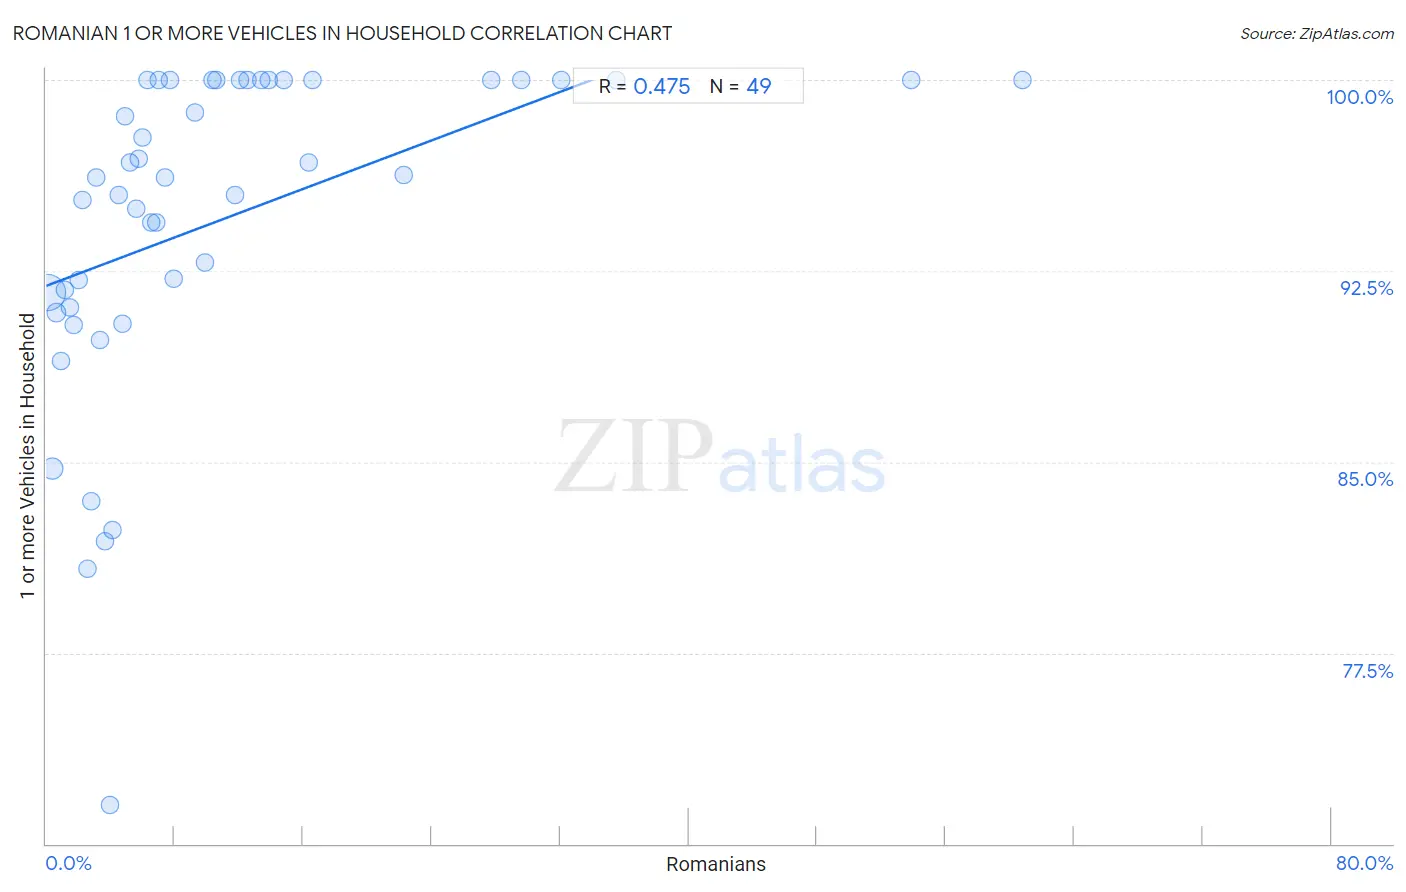
Romanian 1 or more Vehicles in Household Correlation Chart

The statistical analysis conducted on geographies consisting of 377,747,936 people shows a moderate positive correlation between the proportion of Romanians and percentage of households with 1 or more vehicles available in the United States with a correlation coefficient (R) of 0.475 and weighted average of 89.2%. On average, for every 1% (one percent) increase in Romanians within a typical geography, there is an increase of 0.24% in percentage of households with 1 or more vehicles available.
Romanian 1 or more Vehicles in Household
It is essential to understand that the correlation between the percentage of Romanians and percentage of households with 1 or more vehicles available does not imply a direct cause-and-effect relationship. It remains uncertain whether the presence of Romanians influences an upward or downward trend in the level of percentage of households with 1 or more vehicles available within an area, or if Romanians simply ended up residing in those areas with higher or lower levels of percentage of households with 1 or more vehicles available due to other factors.

Demographics Similar to Romanians by 1 or more Vehicles in Household

In terms of 1 or more vehicles in household, the demographic groups most similar to Romanians are Guatemalan (89.2%, a difference of 0.010%), Cambodian (89.2%, a difference of 0.020%), Iroquois (89.2%, a difference of 0.040%), Immigrants from Western Europe (89.2%, a difference of 0.060%), and Apache (89.1%, a difference of 0.060%).
DemographicsRating | Rank1 or more Vehicles in Household
Immigrants from Sweden
23.6
/100
|
#197
Fair
89.3%
Pennsylvania Germans
22.9
/100
|
#198
Fair
89.3%
Immigrants from Asia
22.8
/100
|
#199
Fair
89.3%
Central Americans
21.4
/100
|
#200
Fair
89.2%
Immigrants from Western Europe
20.5
/100
|
#201
Fair
89.2%
Iroquois
19.8
/100
|
#202
Poor
89.2%
Cambodians
18.9
/100
|
#203
Poor
89.2%
Romanians
18.2
/100
|
#204
Poor
89.2%
Guatemalans
17.8
/100
|
#205
Poor
89.2%
Apache
16.2
/100
|
#206
Poor
89.1%
Immigrants from Denmark
14.8
/100
|
#207
Poor
89.1%
Immigrants from Chile
14.4
/100
|
#208
Poor
89.1%
Immigrants from Italy
14.0
/100
|
#209
Poor
89.1%
Dutch West Indians
13.5
/100
|
#210
Poor
89.0%
Sierra Leoneans
13.0
/100
|
#211
Poor
89.0%

Romanian 1 or more Vehicles in Household Correlation Summary

MeasurementRomanian Data1 or more Vehicles in Household Data
Minimum0.10%71.5%
Maximum60.8%100.0%
Range60.7%28.5%
Mean10.9%94.5%
Median6.6%96.2%
Interquartile 25% (IQ1)3.2%91.4%
Interquartile 75% (IQ3)12.9%100.0%
Interquartile Range (IQR)9.7%8.6%
Standard Deviation (Sample)12.8%6.4%
Standard Deviation (Population)12.6%6.3%

Correlation Details

Romanian PercentileSample Size1 or more Vehicles in Household
[
0.0%
-
0.5%
]
0.10%
284,488,42991.7%
[
0.0%
-
0.5%
]
0.36%
62,624,11284.7%
[
0.5%
-
1.0%
]
0.66%
15,565,17790.9%
[
0.5%
-
1.0%
]
0.93%
7,459,59689.0%
[
1.0%
-
1.5%
]
1.19%
3,348,72191.7%
[
1.0%
-
1.5%
]
1.46%
1,442,10591.1%
[
1.5%
-
2.0%
]
1.75%
927,54590.4%
[
2.0%
-
2.5%
]
2.02%
583,25792.2%
[
2.0%
-
2.5%
]
2.28%
341,55295.3%
[
2.5%
-
3.0%
]
2.53%
298,41480.8%
[
2.5%
-
3.0%
]
2.83%
217,72083.5%
[
3.0%
-
3.5%
]
3.09%
39,24796.2%
[
3.0%
-
3.5%
]
3.35%
122,32389.8%
[
3.5%
-
4.0%
]
3.63%
85,73981.9%
[
3.5%
-
4.0%
]
3.94%
64,91971.5%
[
4.0%
-
4.5%
]
4.13%
65,77482.3%
[
4.0%
-
4.5%
]
4.49%
7,82595.5%
[
4.5%
-
5.0%
]
4.78%
3,36890.4%
[
4.5%
-
5.0%
]
4.93%
4,05798.6%
[
5.0%
-
5.5%
]
5.22%
7,06596.8%
[
5.5%
-
6.0%
]
5.58%
3,60395.0%
[
5.5%
-
6.0%
]
5.79%
18,32396.9%
[
5.5%
-
6.0%
]
5.97%
4,83997.8%
[
6.0%
-
6.5%
]
6.30%
540100.0%
[
6.5%
-
7.0%
]
6.57%
4,90394.4%
[
6.5%
-
7.0%
]
6.84%
3,85894.4%
[
7.0%
-
7.5%
]
7.01%
214100.0%
[
7.0%
-
7.5%
]
7.41%
37896.2%
[
7.5%
-
8.0%
]
7.69%
13100.0%
[
7.5%
-
8.0%
]
7.96%
37792.2%
[
9.0%
-
9.5%
]
9.30%
1,99098.7%
[
9.5%
-
10.0%
]
9.90%
3,58692.8%
[
10.0%
-
10.5%
]
10.32%
659100.0%
[
10.5%
-
11.0%
]
10.55%
919100.0%
[
11.5%
-
12.0%
]
11.74%
42695.5%
[
12.0%
-
12.5%
]
12.10%
1,885100.0%
[
12.0%
-
12.5%
]
12.50%
40100.0%
[
13.0%
-
13.5%
]
13.36%
247100.0%
[
13.5%
-
14.0%
]
13.88%
353100.0%
[
14.5%
-
15.0%
]
14.75%
278100.0%
[
16.0%
-
16.5%
]
16.36%
22096.7%
[
16.5%
-
17.0%
]
16.61%
319100.0%
[
22.0%
-
22.5%
]
22.22%
78396.3%
[
27.5%
-
28.0%
]
27.70%
1,668100.0%
[
29.5%
-
30.0%
]
29.59%
98100.0%
[
32.0%
-
32.5%
]
32.05%
78100.0%
[
35.0%
-
35.5%
]
35.48%
93100.0%
[
53.5%
-
54.0%
]
53.85%
13100.0%
[
60.5%
-
61.0%
]
60.76%
288100.0%