Romanian 2 or more Vehicles in Household

COMPARE

Romanian
Race
Ancestry
AfghanAfricanAlaska NativeAlaskan AthabascanAlbanianAleutAlsatianAmericanApacheArabArapahoArgentineanArmenianAssyrian/Chaldean/SyriacAustralianAustrianBahamianBangladeshiBarbadianBasqueBelgianBelizeanBermudanBhutaneseBlackfeetBolivianBrazilianBritishBritish West IndianBulgarianBurmeseCajunCambodianCanadianCape VerdeanCarpatho RusynCelticCentral AmericanCentral American IndianCherokeeCheyenneChickasawChileanChineseChippewaChoctawColombianColvilleComancheCosta RicanCreeCreekCroatianCrowCubanCypriotCzechCzechoslovakianDanishDelawareDominicanDutchDutch West IndianEastern EuropeanEcuadorianEgyptianEnglishEstonianEthiopianEuropeanFijianFilipinoFinnishFrenchFrench American IndianFrench CanadianGermanGerman RussianGhanaianGreekGuamanian/ChamorroGuatemalanGuyaneseHaitianHmongHonduranHopiHoumaHungarianIcelanderIndian (Asian)IndonesianInupiatIranianIraqiIrishIroquoisIsraeliItalianJamaicanJapaneseJordanianKenyanKiowaKoreanLaotianLatvianLebaneseLiberianLithuanianLumbeeLuxembourgerMacedonianMalaysianMalteseMarshalleseMenomineeMexicanMexican American IndianMongolianMoroccanNative HawaiianNavajoNepaleseNew ZealanderNicaraguanNigerianNorthern EuropeanNorwegianOkinawanOsageOttawaPaiutePakistaniPalestinianPanamanianParaguayanPennsylvania GermanPeruvianPimaPolishPortuguesePotawatomiPuebloPuerto RicanPuget Sound SalishRomanianRussianSalvadoranSamoanScandinavianScotch-IrishScottishSeminoleSenegaleseSerbianShoshoneSierra LeoneanSiouxSlavicSlovakSloveneSomaliSouth AfricanSouth AmericanSouth American IndianSoviet UnionSpaniardSpanishSpanish AmericanSpanish American IndianSri LankanSubsaharan AfricanSudaneseSwedishSwissSyrianTaiwaneseThaiTlingit-HaidaTohono O'OdhamTonganTrinidadian and TobagonianTsimshianTurkishU.S. Virgin IslanderUgandanUkrainianUruguayanUteVenezuelanVietnameseWelshWest IndianYakamaYaquiYugoslavianYumanYup'ikZimbabwean
Immigration
NonimmigrantsImmigrantsAfghanistanAfricaAlbaniaArgentinaArmeniaAsiaAustraliaAustriaBahamasBangladeshBarbadosBelarusBelgiumBelizeBoliviaBosnia and HerzegovinaBrazilBulgariaBurma/MyanmarCabo VerdeCambodiaCameroonCanadaCaribbeanCentral AmericaChileChinaColombiaCongoCosta RicaCroatiaCubaCzechoslovakiaDenmarkDominicaDominican RepublicEastern AfricaEastern AsiaEastern EuropeEcuadorEgyptEl SalvadorEnglandEritreaEthiopiaEuropeFijiFranceGermanyGhanaGreeceGrenadaGuatemalaGuyanaHaitiHondurasHong KongHungaryIndiaIndonesiaIranIraqIrelandIsraelItalyJamaicaJapanJordanKazakhstanKenyaKoreaKuwaitLaosLatin AmericaLatviaLebanonLiberiaLithuaniaMalaysiaMexicoMicronesiaMiddle AfricaMoldovaMoroccoNepalNetherlandsNicaraguaNigeriaNorth AmericaNorth MacedoniaNorthern AfricaNorthern EuropeNorwayOceaniaPakistanPanamaPeruPhilippinesPolandPortugalRomaniaRussiaSaudi ArabiaScotlandSenegalSerbiaSierra LeoneSingaporeSomaliaSouth AfricaSouth AmericaSouth Central AsiaSouth Eastern AsiaSouthern EuropeSpainSri LankaSt. Vincent and the GrenadinesSudanSwedenSwitzerlandSyriaTaiwanThailandTrinidad and TobagoTurkeyUgandaUkraineUruguayUzbekistanVenezuelaVietnamWest IndiesWestern AfricaWestern AsiaWestern EuropeYemenZaireZimbabweAzores
Select to Compare
Race
Ancestry
AfghanAfricanAlaska NativeAlaskan AthabascanAlbanianAleutAlsatianAmericanApacheArabArapahoArgentineanArmenianAssyrian/Chaldean/SyriacAustralianAustrianBahamianBangladeshiBarbadianBasqueBelgianBelizeanBermudanBhutaneseBlackfeetBolivianBrazilianBritishBritish West IndianBulgarianBurmeseCajunCambodianCanadianCape VerdeanCarpatho RusynCelticCentral AmericanCentral American IndianCherokeeCheyenneChickasawChileanChineseChippewaChoctawColombianColvilleComancheCosta RicanCreeCreekCroatianCrowCubanCypriotCzechCzechoslovakianDanishDelawareDominicanDutchDutch West IndianEastern EuropeanEcuadorianEgyptianEnglishEstonianEthiopianEuropeanFijianFilipinoFinnishFrenchFrench American IndianFrench CanadianGermanGerman RussianGhanaianGreekGuamanian/ChamorroGuatemalanGuyaneseHaitianHmongHonduranHopiHoumaHungarianIcelanderIndian (Asian)IndonesianInupiatIranianIraqiIrishIroquoisIsraeliItalianJamaicanJapaneseJordanianKenyanKiowaKoreanLaotianLatvianLebaneseLiberianLithuanianLumbeeLuxembourgerMacedonianMalaysianMalteseMarshalleseMenomineeMexicanMexican American IndianMongolianMoroccanNative HawaiianNavajoNepaleseNew ZealanderNicaraguanNigerianNorthern EuropeanNorwegianOkinawanOsageOttawaPaiutePakistaniPalestinianPanamanianParaguayanPennsylvania GermanPeruvianPimaPolishPortuguesePotawatomiPuebloPuerto RicanPuget Sound SalishRussianSalvadoranSamoanScandinavianScotch-IrishScottishSeminoleSenegaleseSerbianShoshoneSierra LeoneanSiouxSlavicSlovakSloveneSomaliSouth AfricanSouth AmericanSouth American IndianSoviet UnionSpaniardSpanishSpanish AmericanSpanish American IndianSri LankanSubsaharan AfricanSudaneseSwedishSwissSyrianTaiwaneseThaiTlingit-HaidaTohono O'OdhamTonganTrinidadian and TobagonianTsimshianTurkishU.S. Virgin IslanderUgandanUkrainianUruguayanUteVenezuelanVietnameseWelshWest IndianYakamaYaquiYugoslavianYumanYup'ikZimbabwean
Immigration
NonimmigrantsImmigrantsAfghanistanAfricaAlbaniaArgentinaArmeniaAsiaAustraliaAustriaBahamasBangladeshBarbadosBelarusBelgiumBelizeBoliviaBosnia and HerzegovinaBrazilBulgariaBurma/MyanmarCabo VerdeCambodiaCameroonCanadaCaribbeanCentral AmericaChileChinaColombiaCongoCosta RicaCroatiaCubaCzechoslovakiaDenmarkDominicaDominican RepublicEastern AfricaEastern AsiaEastern EuropeEcuadorEgyptEl SalvadorEnglandEritreaEthiopiaEuropeFijiFranceGermanyGhanaGreeceGrenadaGuatemalaGuyanaHaitiHondurasHong KongHungaryIndiaIndonesiaIranIraqIrelandIsraelItalyJamaicaJapanJordanKazakhstanKenyaKoreaKuwaitLaosLatin AmericaLatviaLebanonLiberiaLithuaniaMalaysiaMexicoMicronesiaMiddle AfricaMoldovaMoroccoNepalNetherlandsNicaraguaNigeriaNorth AmericaNorth MacedoniaNorthern AfricaNorthern EuropeNorwayOceaniaPakistanPanamaPeruPhilippinesPolandPortugalRomaniaRussiaSaudi ArabiaScotlandSenegalSerbiaSierra LeoneSingaporeSomaliaSouth AfricaSouth AmericaSouth Central AsiaSouth Eastern AsiaSouthern EuropeSpainSri LankaSt. Vincent and the GrenadinesSudanSwedenSwitzerlandSyriaTaiwanThailandTrinidad and TobagoTurkeyUgandaUkraineUruguayUzbekistanVenezuelaVietnamWest IndiesWestern AfricaWestern AsiaWestern EuropeYemenZaireZimbabweAzores
2 or more Vehicles in Household
Income
Poverty
Unemployment
Labor Participation
Family Structure
Vehicle Availability
Education Level
Disability

Romanian 2 or more Vehicles in Household
Average

55.5%
2+ VEHICLES AVAILABLE
55.8/ 100
METRIC RATING
170th/ 347
METRIC RANK

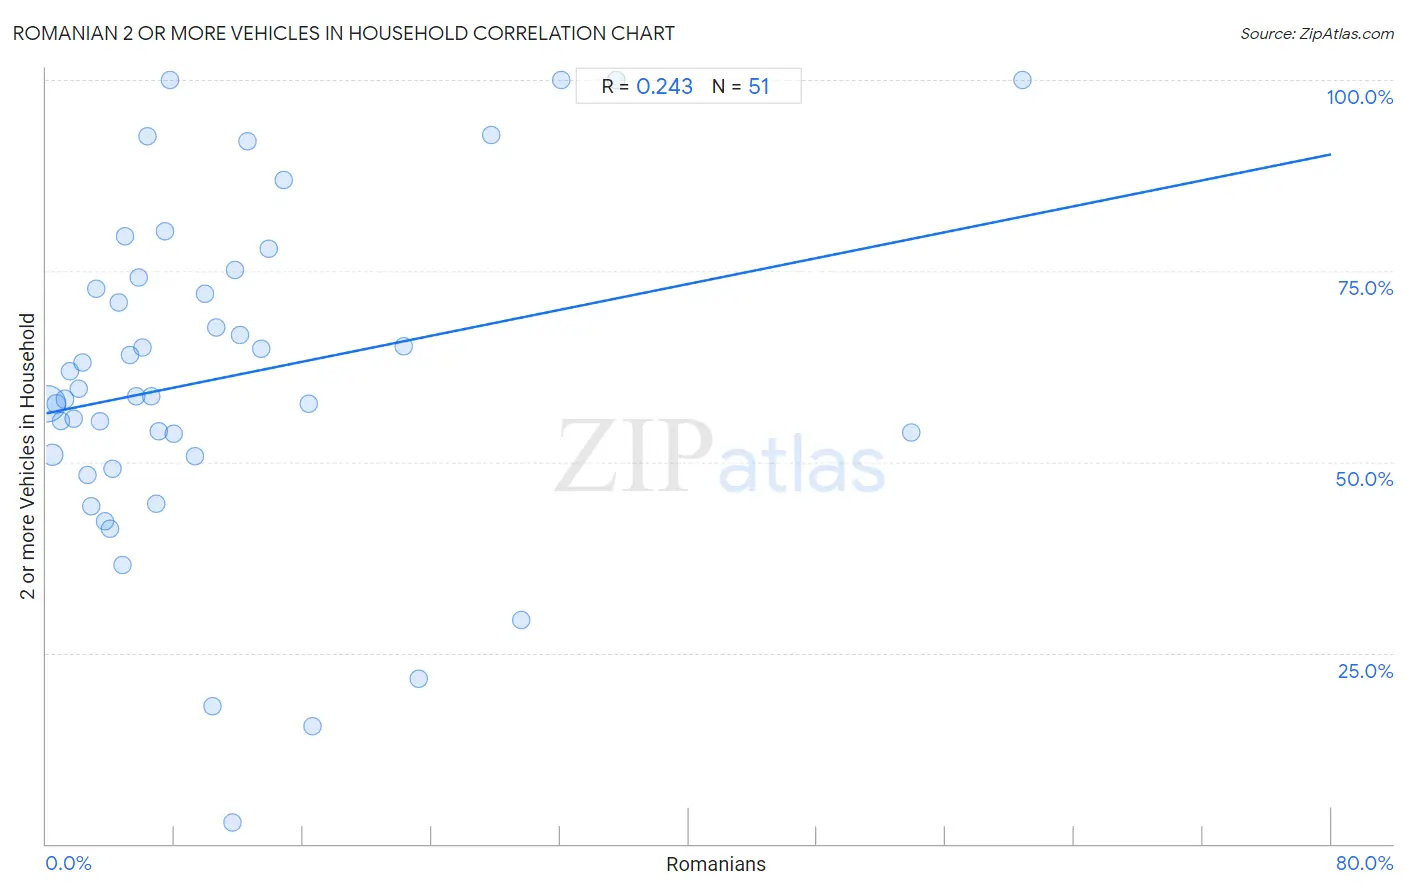
Romanian 2 or more Vehicles in Household Correlation Chart

The statistical analysis conducted on geographies consisting of 377,750,071 people shows a weak positive correlation between the proportion of Romanians and percentage of households with 2 or more vehicles available in the United States with a correlation coefficient (R) of 0.243 and weighted average of 55.5%. On average, for every 1% (one percent) increase in Romanians within a typical geography, there is an increase of 0.42% in percentage of households with 2 or more vehicles available.
Romanian 2 or more Vehicles in Household
It is essential to understand that the correlation between the percentage of Romanians and percentage of households with 2 or more vehicles available does not imply a direct cause-and-effect relationship. It remains uncertain whether the presence of Romanians influences an upward or downward trend in the level of percentage of households with 2 or more vehicles available within an area, or if Romanians simply ended up residing in those areas with higher or lower levels of percentage of households with 2 or more vehicles available due to other factors.

Demographics Similar to Romanians by 2 or more Vehicles in Household

In terms of 2 or more vehicles in household, the demographic groups most similar to Romanians are Immigrants from Austria (55.5%, a difference of 0.020%), French American Indian (55.5%, a difference of 0.030%), Immigrants from Costa Rica (55.4%, a difference of 0.060%), Kenyan (55.5%, a difference of 0.090%), and Immigrants from Sri Lanka (55.5%, a difference of 0.10%).
DemographicsRating | Rank2 or more Vehicles in Household
Immigrants from Zimbabwe
60.2
/100
|
#163
Good
55.6%
Dutch West Indians
59.8
/100
|
#164
Average
55.6%
Immigrants from El Salvador
59.4
/100
|
#165
Average
55.6%
Immigrants from Sri Lanka
58.3
/100
|
#166
Average
55.5%
Kenyans
58.1
/100
|
#167
Average
55.5%
French American Indians
56.7
/100
|
#168
Average
55.5%
Immigrants from Austria
56.3
/100
|
#169
Average
55.5%
Romanians
55.8
/100
|
#170
Average
55.5%
Immigrants from Costa Rica
54.4
/100
|
#171
Average
55.4%
Immigrants from Nicaragua
51.6
/100
|
#172
Average
55.4%
Immigrants from Western Europe
51.4
/100
|
#173
Average
55.4%
Navajo
50.0
/100
|
#174
Average
55.3%
Immigrants from Denmark
49.4
/100
|
#175
Average
55.3%
Immigrants from Cuba
47.0
/100
|
#176
Average
55.3%
Menominee
46.2
/100
|
#177
Average
55.3%

Romanian 2 or more Vehicles in Household Correlation Summary

MeasurementRomanian Data2 or more Vehicles in Household Data
Minimum0.10%2.7%
Maximum60.8%100.0%
Range60.7%97.3%
Mean11.1%61.1%
Median6.8%58.6%
Interquartile 25% (IQ1)3.3%50.7%
Interquartile 75% (IQ3)13.4%74.2%
Interquartile Range (IQR)10.0%23.5%
Standard Deviation (Sample)12.6%22.0%
Standard Deviation (Population)12.5%21.8%

Correlation Details

Romanian PercentileSample Size2 or more Vehicles in Household
[
0.0%
-
0.5%
]
0.10%
284,488,42957.7%
[
0.0%
-
0.5%
]
0.36%
62,622,18850.9%
[
0.5%
-
1.0%
]
0.66%
15,563,35557.6%
[
0.5%
-
1.0%
]
0.93%
7,459,59655.4%
[
1.0%
-
1.5%
]
1.19%
3,348,72158.2%
[
1.0%
-
1.5%
]
1.46%
1,442,10561.8%
[
1.5%
-
2.0%
]
1.75%
927,54555.7%
[
2.0%
-
2.5%
]
2.02%
583,25759.5%
[
2.0%
-
2.5%
]
2.28%
341,55263.1%
[
2.5%
-
3.0%
]
2.53%
297,83248.3%
[
2.5%
-
3.0%
]
2.83%
217,72044.2%
[
3.0%
-
3.5%
]
3.09%
39,24772.7%
[
3.0%
-
3.5%
]
3.35%
122,32355.4%
[
3.5%
-
4.0%
]
3.63%
85,73942.2%
[
3.5%
-
4.0%
]
3.94%
64,91941.2%
[
4.0%
-
4.5%
]
4.13%
65,77449.1%
[
4.0%
-
4.5%
]
4.49%
7,82570.9%
[
4.5%
-
5.0%
]
4.78%
3,36836.6%
[
4.5%
-
5.0%
]
4.93%
4,05779.6%
[
5.0%
-
5.5%
]
5.22%
7,06564.0%
[
5.5%
-
6.0%
]
5.58%
3,60358.6%
[
5.5%
-
6.0%
]
5.79%
18,32374.2%
[
5.5%
-
6.0%
]
5.97%
4,83965.1%
[
6.0%
-
6.5%
]
6.30%
54092.6%
[
6.5%
-
7.0%
]
6.57%
4,90358.6%
[
6.5%
-
7.0%
]
6.84%
3,85844.5%
[
7.0%
-
7.5%
]
7.01%
21454.1%
[
7.0%
-
7.5%
]
7.41%
37880.3%
[
7.5%
-
8.0%
]
7.69%
13100.0%
[
7.5%
-
8.0%
]
7.96%
37753.8%
[
9.0%
-
9.5%
]
9.30%
1,99050.7%
[
9.5%
-
10.0%
]
9.90%
3,58672.0%
[
10.0%
-
10.5%
]
10.32%
65918.1%
[
10.5%
-
11.0%
]
10.55%
91967.6%
[
11.5%
-
12.0%
]
11.56%
5,5012.7%
[
11.5%
-
12.0%
]
11.74%
42675.1%
[
12.0%
-
12.5%
]
12.10%
1,88566.5%
[
12.0%
-
12.5%
]
12.50%
4092.0%
[
13.0%
-
13.5%
]
13.36%
24764.9%
[
13.5%
-
14.0%
]
13.88%
35377.9%
[
14.5%
-
15.0%
]
14.75%
27887.0%
[
16.0%
-
16.5%
]
16.36%
22057.6%
[
16.5%
-
17.0%
]
16.61%
31915.3%
[
22.0%
-
22.5%
]
22.22%
78365.2%
[
23.0%
-
23.5%
]
23.18%
96221.6%
[
27.5%
-
28.0%
]
27.70%
1,66892.8%
[
29.5%
-
30.0%
]
29.59%
9829.2%
[
32.0%
-
32.5%
]
32.05%
78100.0%
[
35.0%
-
35.5%
]
35.48%
93100.0%
[
53.5%
-
54.0%
]
53.85%
1353.8%
[
60.5%
-
61.0%
]
60.76%
288100.0%