Immigrants from Uzbekistan vs Immigrants from Argentina Married-Couple Family Poverty
COMPARE
Immigrants from Uzbekistan
Immigrants from Argentina
Married-Couple Family Poverty
Married-Couple Family Poverty Comparison
Immigrants from Uzbekistan
Immigrants from Argentina
6.6%
MARRIED-COUPLE FAMILY POVERTY
0.0/ 100
METRIC RATING
295th/ 347
METRIC RANK
5.2%
MARRIED-COUPLE FAMILY POVERTY
54.4/ 100
METRIC RATING
170th/ 347
METRIC RANK
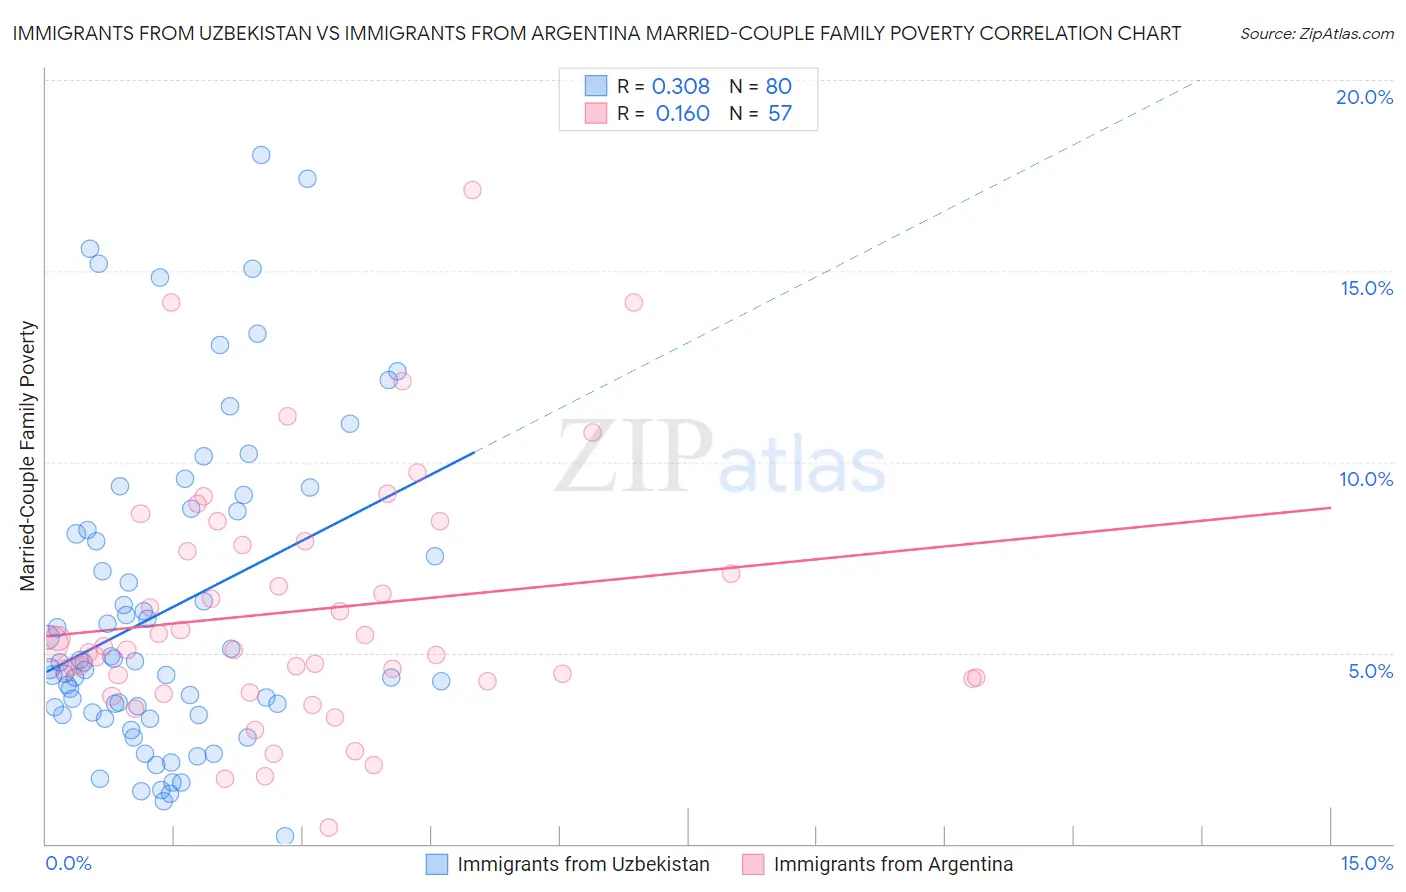
Immigrants from Uzbekistan vs Immigrants from Argentina Married-Couple Family Poverty Correlation Chart
The statistical analysis conducted on geographies consisting of 118,451,122 people shows a mild positive correlation between the proportion of Immigrants from Uzbekistan and poverty level among married-couple families in the United States with a correlation coefficient (R) of 0.308 and weighted average of 6.6%. Similarly, the statistical analysis conducted on geographies consisting of 263,243,889 people shows a poor positive correlation between the proportion of Immigrants from Argentina and poverty level among married-couple families in the United States with a correlation coefficient (R) of 0.160 and weighted average of 5.2%, a difference of 27.9%.
Married-Couple Family Poverty Correlation Summary
| Measurement | Immigrants from Uzbekistan | Immigrants from Argentina |
| Minimum | 0.18% | 0.43% |
| Maximum | 18.0% | 17.1% |
| Range | 17.8% | 16.7% |
| Mean | 6.2% | 6.1% |
| Median | 4.7% | 5.1% |
| Interquartile 25% (IQ1) | 3.4% | 4.3% |
| Interquartile 75% (IQ3) | 8.5% | 7.9% |
| Interquartile Range (IQR) | 5.0% | 3.6% |
| Standard Deviation (Sample) | 4.1% | 3.3% |
| Standard Deviation (Population) | 4.1% | 3.2% |
Similar Demographics by Married-Couple Family Poverty
Demographics Similar to Immigrants from Uzbekistan by Married-Couple Family Poverty
In terms of married-couple family poverty, the demographic groups most similar to Immigrants from Uzbekistan are U.S. Virgin Islander (6.6%, a difference of 0.10%), Kiowa (6.6%, a difference of 0.11%), Immigrants from Guyana (6.7%, a difference of 0.18%), Bahamian (6.6%, a difference of 0.29%), and Nicaraguan (6.7%, a difference of 0.73%).
| Demographics | Rating | Rank | Married-Couple Family Poverty |
| Salvadorans | 0.0 /100 | #288 | Tragic 6.5% |
| Nepalese | 0.0 /100 | #289 | Tragic 6.5% |
| Immigrants | Barbados | 0.0 /100 | #290 | Tragic 6.5% |
| Belizeans | 0.0 /100 | #291 | Tragic 6.5% |
| Immigrants | Lebanon | 0.0 /100 | #292 | Tragic 6.6% |
| Arapaho | 0.0 /100 | #293 | Tragic 6.6% |
| Bahamians | 0.0 /100 | #294 | Tragic 6.6% |
| Immigrants | Uzbekistan | 0.0 /100 | #295 | Tragic 6.6% |
| U.S. Virgin Islanders | 0.0 /100 | #296 | Tragic 6.6% |
| Kiowa | 0.0 /100 | #297 | Tragic 6.6% |
| Immigrants | Guyana | 0.0 /100 | #298 | Tragic 6.7% |
| Nicaraguans | 0.0 /100 | #299 | Tragic 6.7% |
| Immigrants | Belize | 0.0 /100 | #300 | Tragic 6.7% |
| Central Americans | 0.0 /100 | #301 | Tragic 6.7% |
| Immigrants | Ecuador | 0.0 /100 | #302 | Tragic 6.7% |
Demographics Similar to Immigrants from Argentina by Married-Couple Family Poverty
In terms of married-couple family poverty, the demographic groups most similar to Immigrants from Argentina are Ottawa (5.2%, a difference of 0.010%), Immigrants from Uganda (5.2%, a difference of 0.060%), Bermudan (5.2%, a difference of 0.18%), Immigrants from Northern Africa (5.2%, a difference of 0.35%), and Alsatian (5.2%, a difference of 0.37%).
| Demographics | Rating | Rank | Married-Couple Family Poverty |
| Sierra Leoneans | 64.1 /100 | #163 | Good 5.1% |
| Hawaiians | 62.3 /100 | #164 | Good 5.1% |
| Immigrants | Malaysia | 62.2 /100 | #165 | Good 5.1% |
| Paraguayans | 61.5 /100 | #166 | Good 5.1% |
| Costa Ricans | 61.5 /100 | #167 | Good 5.1% |
| Immigrants | Uganda | 54.9 /100 | #168 | Average 5.2% |
| Ottawa | 54.5 /100 | #169 | Average 5.2% |
| Immigrants | Argentina | 54.4 /100 | #170 | Average 5.2% |
| Bermudans | 52.9 /100 | #171 | Average 5.2% |
| Immigrants | Northern Africa | 51.3 /100 | #172 | Average 5.2% |
| Alsatians | 51.2 /100 | #173 | Average 5.2% |
| Immigrants | Eastern Africa | 50.0 /100 | #174 | Average 5.2% |
| Marshallese | 47.9 /100 | #175 | Average 5.2% |
| Menominee | 47.8 /100 | #176 | Average 5.2% |
| Immigrants | Kazakhstan | 45.1 /100 | #177 | Average 5.2% |