Immigrants from Uzbekistan vs Belgian Married-Couple Family Poverty
COMPARE
Immigrants from Uzbekistan
Belgian
Married-Couple Family Poverty
Married-Couple Family Poverty Comparison
Immigrants from Uzbekistan
Belgians
6.6%
MARRIED-COUPLE FAMILY POVERTY
0.0/ 100
METRIC RATING
295th/ 347
METRIC RANK
4.2%
MARRIED-COUPLE FAMILY POVERTY
99.9/ 100
METRIC RATING
38th/ 347
METRIC RANK
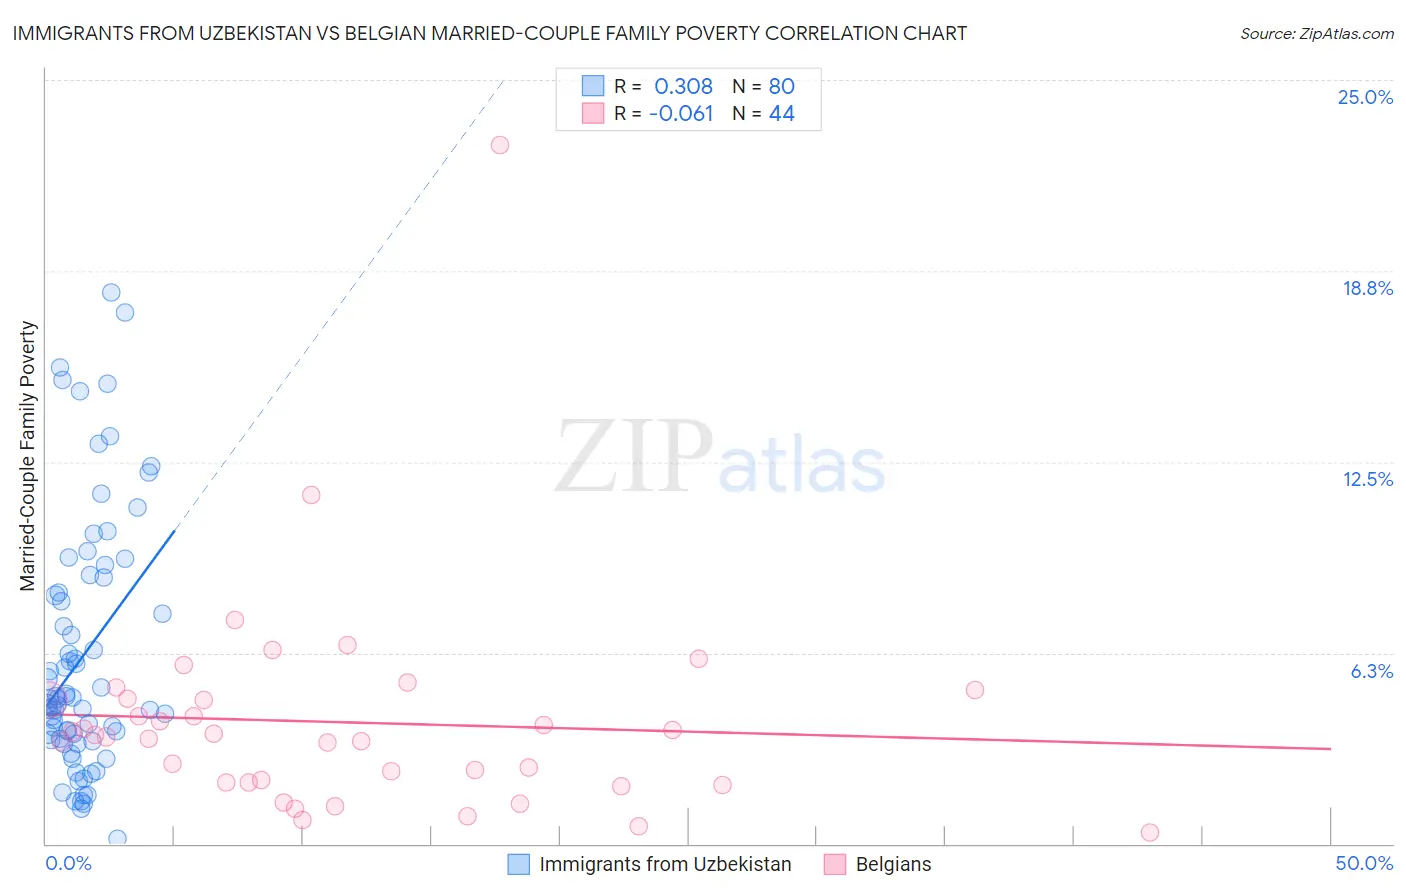
Immigrants from Uzbekistan vs Belgian Married-Couple Family Poverty Correlation Chart
The statistical analysis conducted on geographies consisting of 118,451,122 people shows a mild positive correlation between the proportion of Immigrants from Uzbekistan and poverty level among married-couple families in the United States with a correlation coefficient (R) of 0.308 and weighted average of 6.6%. Similarly, the statistical analysis conducted on geographies consisting of 352,443,017 people shows a slight negative correlation between the proportion of Belgians and poverty level among married-couple families in the United States with a correlation coefficient (R) of -0.061 and weighted average of 4.2%, a difference of 56.9%.
Married-Couple Family Poverty Correlation Summary
| Measurement | Immigrants from Uzbekistan | Belgian |
| Minimum | 0.18% | 0.38% |
| Maximum | 18.0% | 22.9% |
| Range | 17.8% | 22.5% |
| Mean | 6.2% | 4.0% |
| Median | 4.7% | 3.5% |
| Interquartile 25% (IQ1) | 3.4% | 2.0% |
| Interquartile 75% (IQ3) | 8.5% | 4.7% |
| Interquartile Range (IQR) | 5.0% | 2.7% |
| Standard Deviation (Sample) | 4.1% | 3.6% |
| Standard Deviation (Population) | 4.1% | 3.5% |
Similar Demographics by Married-Couple Family Poverty
Demographics Similar to Immigrants from Uzbekistan by Married-Couple Family Poverty
In terms of married-couple family poverty, the demographic groups most similar to Immigrants from Uzbekistan are U.S. Virgin Islander (6.6%, a difference of 0.10%), Kiowa (6.6%, a difference of 0.11%), Immigrants from Guyana (6.7%, a difference of 0.18%), Bahamian (6.6%, a difference of 0.29%), and Nicaraguan (6.7%, a difference of 0.73%).
| Demographics | Rating | Rank | Married-Couple Family Poverty |
| Salvadorans | 0.0 /100 | #288 | Tragic 6.5% |
| Nepalese | 0.0 /100 | #289 | Tragic 6.5% |
| Immigrants | Barbados | 0.0 /100 | #290 | Tragic 6.5% |
| Belizeans | 0.0 /100 | #291 | Tragic 6.5% |
| Immigrants | Lebanon | 0.0 /100 | #292 | Tragic 6.6% |
| Arapaho | 0.0 /100 | #293 | Tragic 6.6% |
| Bahamians | 0.0 /100 | #294 | Tragic 6.6% |
| Immigrants | Uzbekistan | 0.0 /100 | #295 | Tragic 6.6% |
| U.S. Virgin Islanders | 0.0 /100 | #296 | Tragic 6.6% |
| Kiowa | 0.0 /100 | #297 | Tragic 6.6% |
| Immigrants | Guyana | 0.0 /100 | #298 | Tragic 6.7% |
| Nicaraguans | 0.0 /100 | #299 | Tragic 6.7% |
| Immigrants | Belize | 0.0 /100 | #300 | Tragic 6.7% |
| Central Americans | 0.0 /100 | #301 | Tragic 6.7% |
| Immigrants | Ecuador | 0.0 /100 | #302 | Tragic 6.7% |
Demographics Similar to Belgians by Married-Couple Family Poverty
In terms of married-couple family poverty, the demographic groups most similar to Belgians are Iranian (4.2%, a difference of 0.12%), Immigrants from Northern Europe (4.2%, a difference of 0.13%), English (4.2%, a difference of 0.19%), European (4.2%, a difference of 0.22%), and French Canadian (4.2%, a difference of 0.41%).
| Demographics | Rating | Rank | Married-Couple Family Poverty |
| Estonians | 99.9 /100 | #31 | Exceptional 4.2% |
| Greeks | 99.9 /100 | #32 | Exceptional 4.2% |
| Irish | 99.9 /100 | #33 | Exceptional 4.2% |
| Dutch | 99.9 /100 | #34 | Exceptional 4.2% |
| Europeans | 99.9 /100 | #35 | Exceptional 4.2% |
| English | 99.9 /100 | #36 | Exceptional 4.2% |
| Iranians | 99.9 /100 | #37 | Exceptional 4.2% |
| Belgians | 99.9 /100 | #38 | Exceptional 4.2% |
| Immigrants | Northern Europe | 99.8 /100 | #39 | Exceptional 4.2% |
| French Canadians | 99.8 /100 | #40 | Exceptional 4.2% |
| Northern Europeans | 99.8 /100 | #41 | Exceptional 4.3% |
| Scottish | 99.8 /100 | #42 | Exceptional 4.3% |
| Swiss | 99.8 /100 | #43 | Exceptional 4.3% |
| Immigrants | Japan | 99.8 /100 | #44 | Exceptional 4.3% |
| Serbians | 99.8 /100 | #45 | Exceptional 4.3% |