Hungarian Married-couple Households
COMPARE
Hungarian
Select to Compare
Married-couple Households
Hungarian Married-couple Households
49.1%
MARRIED-COUPLE HOUSEHOLDS
99.8/ 100
METRIC RATING
32nd/ 347
METRIC RANK
Hungarian Married-couple Households Correlation Chart
The statistical analysis conducted on geographies consisting of 485,875,006 people shows a weak positive correlation between the proportion of Hungarians and percentage of married-couple family households in the United States with a correlation coefficient (R) of 0.279 and weighted average of 49.1%. On average, for every 1% (one percent) increase in Hungarians within a typical geography, there is an increase of 0.29% in percentage of married-couple family households.
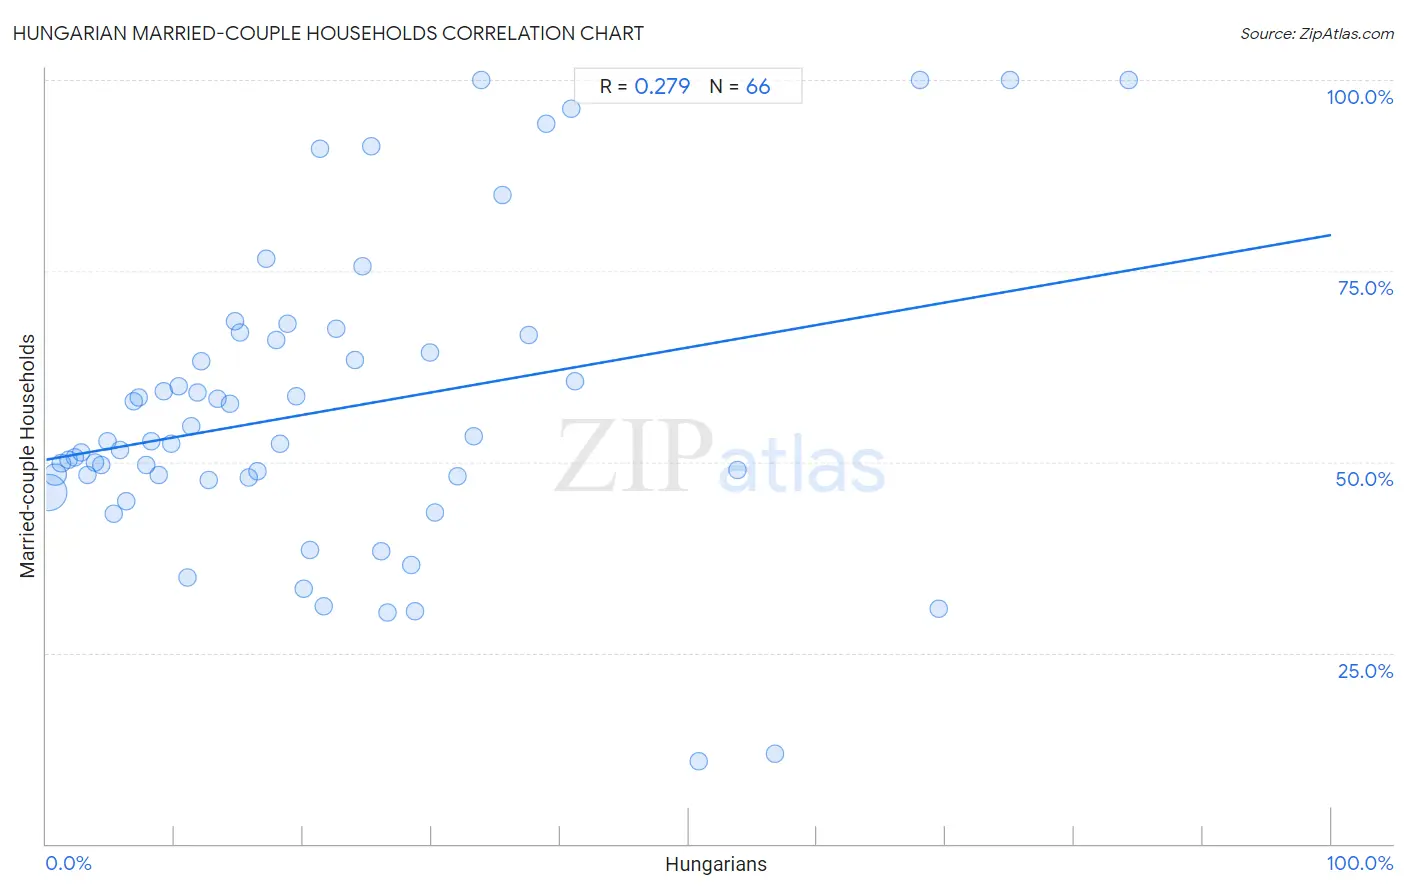
It is essential to understand that the correlation between the percentage of Hungarians and percentage of married-couple family households does not imply a direct cause-and-effect relationship. It remains uncertain whether the presence of Hungarians influences an upward or downward trend in the level of percentage of married-couple family households within an area, or if Hungarians simply ended up residing in those areas with higher or lower levels of percentage of married-couple family households due to other factors.
Demographics Similar to Hungarians by Married-couple Households
In terms of married-couple households, the demographic groups most similar to Hungarians are Immigrants from Asia (49.1%, a difference of 0.030%), Native Hawaiian (49.1%, a difference of 0.060%), Italian (49.0%, a difference of 0.11%), Scottish (49.0%, a difference of 0.13%), and Bolivian (49.2%, a difference of 0.17%).
| Demographics | Rating | Rank | Married-couple Households |
| Immigrants from Philippines | 99.9 /100 | #25 | Exceptional 49.3% |
| Immigrants from Scotland | 99.8 /100 | #26 | Exceptional 49.3% |
| Bhutanese | 99.8 /100 | #27 | Exceptional 49.3% |
| Germans | 99.8 /100 | #28 | Exceptional 49.2% |
| Maltese | 99.8 /100 | #29 | Exceptional 49.2% |
| Bolivians | 99.8 /100 | #30 | Exceptional 49.2% |
| Native Hawaiians | 99.8 /100 | #31 | Exceptional 49.1% |
| Hungarians | 99.8 /100 | #32 | Exceptional 49.1% |
| Immigrants from Asia | 99.7 /100 | #33 | Exceptional 49.1% |
| Italians | 99.7 /100 | #34 | Exceptional 49.0% |
| Scottish | 99.7 /100 | #35 | Exceptional 49.0% |
| Iranians | 99.7 /100 | #36 | Exceptional 49.0% |
| Sri Lankans | 99.7 /100 | #37 | Exceptional 49.0% |
| Greeks | 99.7 /100 | #38 | Exceptional 48.9% |
| Lithuanians | 99.6 /100 | #39 | Exceptional 48.9% |
Hungarian Married-couple Households Correlation Summary
| Measurement | Hungarian Data | Married-couple Households Data |
| Minimum | 0.21% | 10.9% |
| Maximum | 84.3% | 100.0% |
| Range | 84.0% | 89.1% |
| Mean | 22.0% | 56.7% |
| Median | 17.5% | 52.5% |
| Interquartile 25% (IQ1) | 8.2% | 47.9% |
| Interquartile 75% (IQ3) | 29.8% | 65.9% |
| Interquartile Range (IQR) | 21.6% | 18.0% |
| Standard Deviation (Sample) | 18.9% | 19.9% |
| Standard Deviation (Population) | 18.7% | 19.8% |
Correlation Details
| Hungarian Percentile | Sample Size | Married-couple Households |
[ 0.0% - 0.5% ] 0.21% | 357,121,722 | 46.1% |
[ 0.5% - 1.0% ] 0.68% | 85,735,877 | 48.3% |
[ 1.0% - 1.5% ] 1.20% | 21,846,146 | 49.8% |
[ 1.5% - 2.0% ] 1.73% | 8,697,265 | 50.3% |
[ 2.0% - 2.5% ] 2.23% | 4,101,648 | 50.5% |
[ 2.5% - 3.0% ] 2.75% | 2,278,614 | 51.2% |
[ 3.0% - 3.5% ] 3.24% | 1,850,403 | 48.3% |
[ 3.5% - 4.0% ] 3.77% | 1,316,202 | 49.9% |
[ 4.0% - 4.5% ] 4.26% | 909,197 | 49.7% |
[ 4.5% - 5.0% ] 4.74% | 463,093 | 52.7% |
[ 5.0% - 5.5% ] 5.28% | 442,863 | 43.2% |
[ 5.5% - 6.0% ] 5.78% | 155,360 | 51.5% |
[ 6.0% - 6.5% ] 6.22% | 150,307 | 44.8% |
[ 6.5% - 7.0% ] 6.77% | 120,507 | 57.9% |
[ 7.0% - 7.5% ] 7.18% | 84,345 | 58.4% |
[ 7.5% - 8.0% ] 7.75% | 71,068 | 49.6% |
[ 8.0% - 8.5% ] 8.21% | 48,575 | 52.6% |
[ 8.5% - 9.0% ] 8.71% | 28,723 | 48.4% |
[ 9.0% - 9.5% ] 9.16% | 20,530 | 59.3% |
[ 9.5% - 10.0% ] 9.72% | 13,611 | 52.4% |
[ 10.0% - 10.5% ] 10.32% | 6,745 | 59.9% |
[ 10.5% - 11.0% ] 10.94% | 55,636 | 34.9% |
[ 11.0% - 11.5% ] 11.30% | 26,068 | 54.6% |
[ 11.5% - 12.0% ] 11.76% | 18,859 | 59.1% |
[ 12.0% - 12.5% ] 12.06% | 77,181 | 63.1% |
[ 12.5% - 13.0% ] 12.68% | 2,823 | 47.6% |
[ 13.0% - 13.5% ] 13.32% | 2,717 | 58.2% |
[ 14.0% - 14.5% ] 14.26% | 589 | 57.7% |
[ 14.5% - 15.0% ] 14.72% | 795 | 68.4% |
[ 15.0% - 15.5% ] 15.05% | 7,256 | 67.0% |
[ 15.5% - 16.0% ] 15.79% | 266 | 47.9% |
[ 16.0% - 16.5% ] 16.42% | 134 | 48.7% |
[ 17.0% - 17.5% ] 17.14% | 49,953 | 76.6% |
[ 17.5% - 18.0% ] 17.94% | 853 | 65.9% |
[ 18.0% - 18.5% ] 18.23% | 1,871 | 52.4% |
[ 18.5% - 19.0% ] 18.80% | 947 | 68.1% |
[ 19.0% - 19.5% ] 19.42% | 1,921 | 58.6% |
[ 20.0% - 20.5% ] 20.00% | 35 | 33.4% |
[ 20.0% - 20.5% ] 20.49% | 610 | 38.5% |
[ 21.0% - 21.5% ] 21.34% | 28,607 | 91.0% |
[ 21.5% - 22.0% ] 21.57% | 2,035 | 31.1% |
[ 22.5% - 23.0% ] 22.53% | 7,385 | 67.4% |
[ 24.0% - 24.5% ] 24.00% | 125 | 63.4% |
[ 24.5% - 25.0% ] 24.63% | 64,313 | 75.6% |
[ 25.0% - 25.5% ] 25.29% | 6,460 | 91.3% |
[ 26.0% - 26.5% ] 26.04% | 864 | 38.3% |
[ 26.5% - 27.0% ] 26.60% | 188 | 30.2% |
[ 28.0% - 28.5% ] 28.39% | 236 | 36.5% |
[ 28.5% - 29.0% ] 28.68% | 638 | 30.4% |
[ 29.5% - 30.0% ] 29.83% | 1,056 | 64.4% |
[ 30.0% - 30.5% ] 30.23% | 258 | 43.4% |
[ 31.5% - 32.0% ] 31.96% | 3,858 | 48.1% |
[ 33.0% - 33.5% ] 33.30% | 871 | 53.3% |
[ 33.5% - 34.0% ] 33.83% | 133 | 100.0% |
[ 35.5% - 36.0% ] 35.53% | 76 | 85.0% |
[ 37.0% - 37.5% ] 37.50% | 48 | 66.7% |
[ 38.5% - 39.0% ] 38.95% | 9,614 | 94.3% |
[ 40.5% - 41.0% ] 40.81% | 34,571 | 96.3% |
[ 41.0% - 41.5% ] 41.12% | 1,481 | 60.5% |
[ 50.5% - 51.0% ] 50.79% | 315 | 10.9% |
[ 53.5% - 54.0% ] 53.76% | 173 | 48.9% |
[ 56.5% - 57.0% ] 56.67% | 60 | 11.8% |
[ 68.0% - 68.5% ] 68.00% | 25 | 100.0% |
[ 69.0% - 69.5% ] 69.48% | 154 | 30.8% |
[ 75.0% - 75.5% ] 75.00% | 20 | 100.0% |
[ 84.0% - 84.5% ] 84.25% | 127 | 100.0% |