Hungarian Disability
COMPARE
Hungarian
Select to Compare
Disability
Hungarian Disability
12.2%
DISABILITY
1.7/ 100
METRIC RATING
240th/ 347
METRIC RANK
Hungarian Disability Correlation Chart
The statistical analysis conducted on geographies consisting of 486,180,390 people shows a slight positive correlation between the proportion of Hungarians and percentage of population with a disability in the United States with a correlation coefficient (R) of 0.093 and weighted average of 12.2%. On average, for every 1% (one percent) increase in Hungarians within a typical geography, there is an increase of 0.046% in percentage of population with a disability.
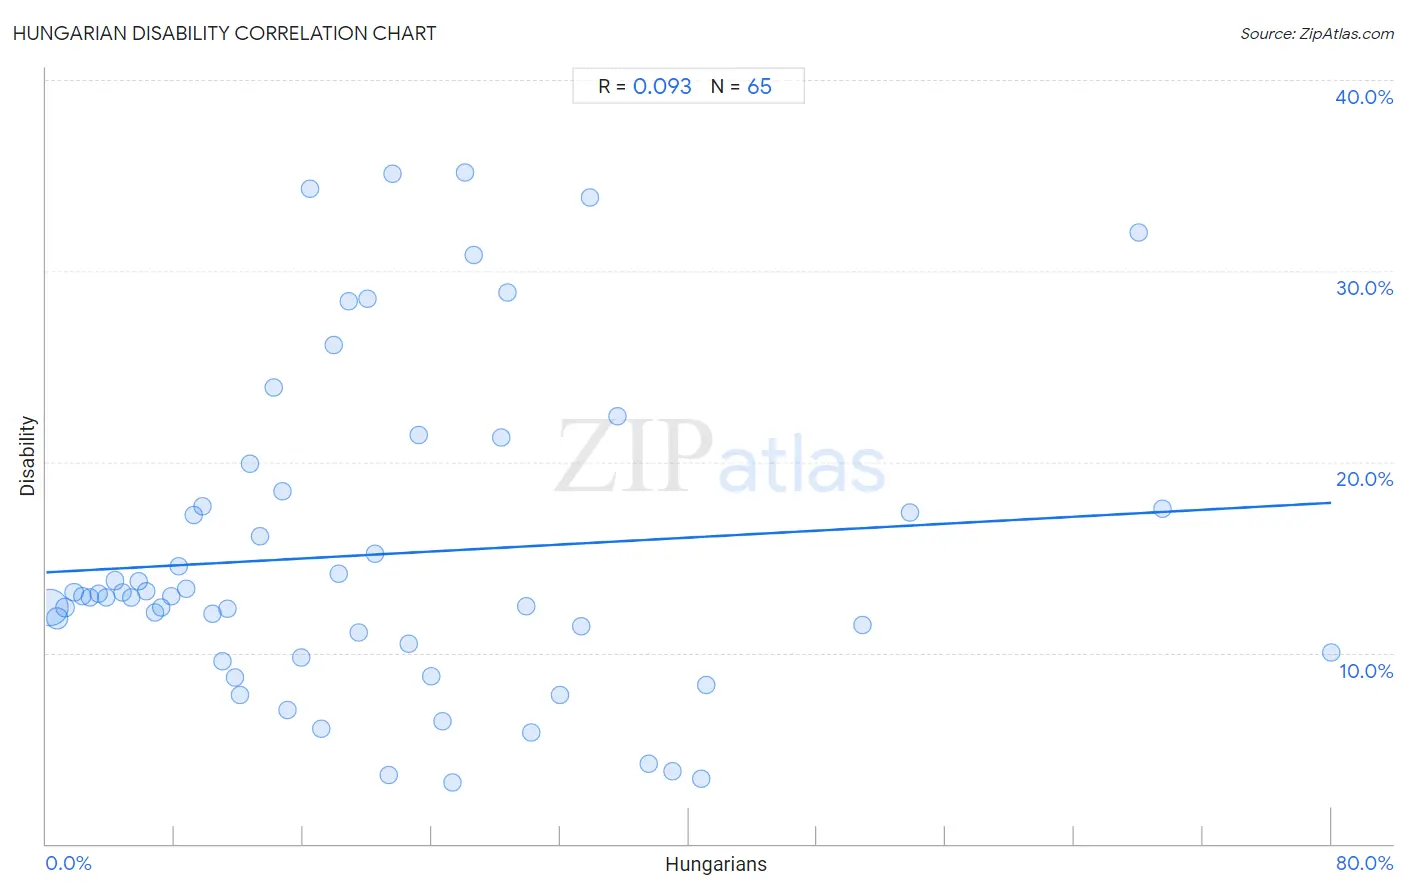
It is essential to understand that the correlation between the percentage of Hungarians and percentage of population with a disability does not imply a direct cause-and-effect relationship. It remains uncertain whether the presence of Hungarians influences an upward or downward trend in the level of percentage of population with a disability within an area, or if Hungarians simply ended up residing in those areas with higher or lower levels of percentage of population with a disability due to other factors.
Demographics Similar to Hungarians by Disability
In terms of disability, the demographic groups most similar to Hungarians are Yugoslavian (12.2%, a difference of 0.0%), Polish (12.2%, a difference of 0.020%), Swedish (12.2%, a difference of 0.050%), Norwegian (12.2%, a difference of 0.090%), and British (12.2%, a difference of 0.11%).
| Demographics | Rating | Rank | Disability |
| Bahamians | 2.3 /100 | #233 | Tragic 12.2% |
| Japanese | 2.3 /100 | #234 | Tragic 12.2% |
| Yup'ik | 2.2 /100 | #235 | Tragic 12.2% |
| Chinese | 2.0 /100 | #236 | Tragic 12.2% |
| Immigrants from Congo | 1.9 /100 | #237 | Tragic 12.2% |
| Norwegians | 1.9 /100 | #238 | Tragic 12.2% |
| Swedes | 1.8 /100 | #239 | Tragic 12.2% |
| Hungarians | 1.7 /100 | #240 | Tragic 12.2% |
| Yugoslavians | 1.7 /100 | #241 | Tragic 12.2% |
| Poles | 1.7 /100 | #242 | Tragic 12.2% |
| British | 1.5 /100 | #243 | Tragic 12.2% |
| Basques | 1.5 /100 | #244 | Tragic 12.2% |
| Liberians | 1.5 /100 | #245 | Tragic 12.2% |
| Swiss | 1.5 /100 | #246 | Tragic 12.2% |
| Indonesians | 1.4 /100 | #247 | Tragic 12.2% |
Hungarian Disability Correlation Summary
| Measurement | Hungarian Data | Disability Data |
| Minimum | 0.21% | 3.2% |
| Maximum | 80.0% | 35.2% |
| Range | 79.8% | 31.9% |
| Mean | 20.6% | 15.1% |
| Median | 17.1% | 12.9% |
| Interquartile 25% (IQ1) | 8.0% | 9.9% |
| Interquartile 75% (IQ3) | 28.5% | 18.1% |
| Interquartile Range (IQR) | 20.5% | 8.2% |
| Standard Deviation (Sample) | 17.0% | 8.3% |
| Standard Deviation (Population) | 16.9% | 8.3% |
Correlation Details
| Hungarian Percentile | Sample Size | Disability |
[ 0.0% - 0.5% ] 0.21% | 357,292,906 | 12.4% |
[ 0.5% - 1.0% ] 0.68% | 85,809,968 | 11.8% |
[ 1.0% - 1.5% ] 1.20% | 21,883,725 | 12.4% |
[ 1.5% - 2.0% ] 1.73% | 8,715,701 | 13.2% |
[ 2.0% - 2.5% ] 2.23% | 4,104,455 | 12.9% |
[ 2.5% - 3.0% ] 2.75% | 2,282,186 | 12.9% |
[ 3.0% - 3.5% ] 3.24% | 1,851,783 | 13.1% |
[ 3.5% - 4.0% ] 3.77% | 1,316,681 | 12.9% |
[ 4.0% - 4.5% ] 4.26% | 909,015 | 13.8% |
[ 4.5% - 5.0% ] 4.74% | 462,592 | 13.1% |
[ 5.0% - 5.5% ] 5.28% | 443,888 | 12.9% |
[ 5.5% - 6.0% ] 5.78% | 156,761 | 13.8% |
[ 6.0% - 6.5% ] 6.22% | 149,921 | 13.2% |
[ 6.5% - 7.0% ] 6.77% | 119,667 | 12.1% |
[ 7.0% - 7.5% ] 7.17% | 80,997 | 12.4% |
[ 7.5% - 8.0% ] 7.75% | 71,016 | 12.9% |
[ 8.0% - 8.5% ] 8.21% | 48,575 | 14.5% |
[ 8.5% - 9.0% ] 8.71% | 28,723 | 13.3% |
[ 9.0% - 9.5% ] 9.16% | 20,461 | 17.2% |
[ 9.5% - 10.0% ] 9.72% | 13,611 | 17.7% |
[ 10.0% - 10.5% ] 10.32% | 6,492 | 12.1% |
[ 10.5% - 11.0% ] 10.94% | 55,636 | 9.6% |
[ 11.0% - 11.5% ] 11.30% | 26,068 | 12.3% |
[ 11.5% - 12.0% ] 11.76% | 18,633 | 8.7% |
[ 12.0% - 12.5% ] 12.06% | 77,181 | 7.8% |
[ 12.5% - 13.0% ] 12.68% | 2,823 | 19.9% |
[ 13.0% - 13.5% ] 13.32% | 2,717 | 16.1% |
[ 14.0% - 14.5% ] 14.20% | 331 | 23.9% |
[ 14.5% - 15.0% ] 14.72% | 795 | 18.5% |
[ 15.0% - 15.5% ] 15.05% | 7,256 | 7.0% |
[ 15.5% - 16.0% ] 15.85% | 164 | 9.8% |
[ 16.0% - 16.5% ] 16.42% | 134 | 34.3% |
[ 17.0% - 17.5% ] 17.14% | 49,953 | 6.0% |
[ 17.5% - 18.0% ] 17.94% | 853 | 26.1% |
[ 18.0% - 18.5% ] 18.23% | 1,920 | 14.1% |
[ 18.5% - 19.0% ] 18.80% | 947 | 28.4% |
[ 19.0% - 19.5% ] 19.42% | 1,792 | 11.0% |
[ 20.0% - 20.5% ] 20.00% | 35 | 28.6% |
[ 20.0% - 20.5% ] 20.49% | 610 | 15.2% |
[ 21.0% - 21.5% ] 21.34% | 28,607 | 3.6% |
[ 21.5% - 22.0% ] 21.57% | 2,035 | 35.1% |
[ 22.5% - 23.0% ] 22.53% | 7,385 | 10.5% |
[ 23.0% - 23.5% ] 23.21% | 224 | 21.4% |
[ 24.0% - 24.5% ] 24.00% | 125 | 8.8% |
[ 24.5% - 25.0% ] 24.63% | 64,313 | 6.4% |
[ 25.0% - 25.5% ] 25.29% | 6,460 | 3.2% |
[ 26.0% - 26.5% ] 26.04% | 864 | 35.2% |
[ 26.5% - 27.0% ] 26.60% | 188 | 30.9% |
[ 28.0% - 28.5% ] 28.34% | 307 | 21.3% |
[ 28.5% - 29.0% ] 28.68% | 638 | 28.8% |
[ 29.5% - 30.0% ] 29.88% | 897 | 12.4% |
[ 30.0% - 30.5% ] 30.23% | 258 | 5.8% |
[ 31.5% - 32.0% ] 31.96% | 3,858 | 7.8% |
[ 33.0% - 33.5% ] 33.30% | 871 | 11.4% |
[ 33.5% - 34.0% ] 33.83% | 133 | 33.8% |
[ 35.5% - 36.0% ] 35.53% | 76 | 22.4% |
[ 37.0% - 37.5% ] 37.50% | 48 | 4.2% |
[ 38.5% - 39.0% ] 38.95% | 9,578 | 3.8% |
[ 40.5% - 41.0% ] 40.81% | 34,395 | 3.4% |
[ 41.0% - 41.5% ] 41.12% | 1,481 | 8.3% |
[ 50.5% - 51.0% ] 50.79% | 315 | 11.4% |
[ 53.5% - 54.0% ] 53.76% | 173 | 17.3% |
[ 68.0% - 68.5% ] 68.00% | 25 | 32.0% |
[ 69.0% - 69.5% ] 69.48% | 154 | 17.5% |
[ 80.0% - 80.5% ] 80.00% | 10 | 10.0% |