Hungarian Receiving Food Stamps

COMPARE

Hungarian
Race
Ancestry
AfghanAfricanAlaska NativeAlaskan AthabascanAlbanianAleutAlsatianAmericanApacheArabArapahoArgentineanArmenianAssyrian/Chaldean/SyriacAustralianAustrianBahamianBangladeshiBarbadianBasqueBelgianBelizeanBermudanBhutaneseBlackfeetBolivianBrazilianBritishBritish West IndianBulgarianBurmeseCajunCambodianCanadianCape VerdeanCarpatho RusynCelticCentral AmericanCentral American IndianCherokeeCheyenneChickasawChileanChineseChippewaChoctawColombianColvilleComancheCosta RicanCreeCreekCroatianCrowCubanCypriotCzechCzechoslovakianDanishDelawareDominicanDutchDutch West IndianEastern EuropeanEcuadorianEgyptianEnglishEstonianEthiopianEuropeanFijianFilipinoFinnishFrenchFrench American IndianFrench CanadianGermanGerman RussianGhanaianGreekGuamanian/ChamorroGuatemalanGuyaneseHaitianHmongHonduranHopiHoumaHungarianIcelanderIndian (Asian)IndonesianInupiatIranianIraqiIrishIroquoisIsraeliItalianJamaicanJapaneseJordanianKenyanKiowaKoreanLaotianLatvianLebaneseLiberianLithuanianLumbeeLuxembourgerMacedonianMalaysianMalteseMarshalleseMenomineeMexicanMexican American IndianMongolianMoroccanNative HawaiianNavajoNepaleseNew ZealanderNicaraguanNigerianNorthern EuropeanNorwegianOkinawanOsageOttawaPaiutePakistaniPalestinianPanamanianParaguayanPennsylvania GermanPeruvianPimaPolishPortuguesePotawatomiPuebloPuerto RicanPuget Sound SalishRomanianRussianSalvadoranSamoanScandinavianScotch-IrishScottishSeminoleSenegaleseSerbianShoshoneSierra LeoneanSiouxSlavicSlovakSloveneSomaliSouth AfricanSouth AmericanSouth American IndianSoviet UnionSpaniardSpanishSpanish AmericanSpanish American IndianSri LankanSubsaharan AfricanSudaneseSwedishSwissSyrianTaiwaneseThaiTlingit-HaidaTohono O'OdhamTonganTrinidadian and TobagonianTsimshianTurkishU.S. Virgin IslanderUgandanUkrainianUruguayanUteVenezuelanVietnameseWelshWest IndianYakamaYaquiYugoslavianYumanYup'ikZimbabwean
Immigration
NonimmigrantsImmigrantsAfghanistanAfricaAlbaniaArgentinaArmeniaAsiaAustraliaAustriaBahamasBangladeshBarbadosBelarusBelgiumBelizeBoliviaBosnia and HerzegovinaBrazilBulgariaBurma/MyanmarCabo VerdeCambodiaCameroonCanadaCaribbeanCentral AmericaChileChinaColombiaCongoCosta RicaCroatiaCubaCzechoslovakiaDenmarkDominicaDominican RepublicEastern AfricaEastern AsiaEastern EuropeEcuadorEgyptEl SalvadorEnglandEritreaEthiopiaEuropeFijiFranceGermanyGhanaGreeceGrenadaGuatemalaGuyanaHaitiHondurasHong KongHungaryIndiaIndonesiaIranIraqIrelandIsraelItalyJamaicaJapanJordanKazakhstanKenyaKoreaKuwaitLaosLatin AmericaLatviaLebanonLiberiaLithuaniaMalaysiaMexicoMicronesiaMiddle AfricaMoldovaMoroccoNepalNetherlandsNicaraguaNigeriaNorth AmericaNorth MacedoniaNorthern AfricaNorthern EuropeNorwayOceaniaPakistanPanamaPeruPhilippinesPolandPortugalRomaniaRussiaSaudi ArabiaScotlandSenegalSerbiaSierra LeoneSingaporeSomaliaSouth AfricaSouth AmericaSouth Central AsiaSouth Eastern AsiaSouthern EuropeSpainSri LankaSt. Vincent and the GrenadinesSudanSwedenSwitzerlandSyriaTaiwanThailandTrinidad and TobagoTurkeyUgandaUkraineUruguayUzbekistanVenezuelaVietnamWest IndiesWestern AfricaWestern AsiaWestern EuropeYemenZaireZimbabweAzores
Select to Compare
Race
Ancestry
AfghanAfricanAlaska NativeAlaskan AthabascanAlbanianAleutAlsatianAmericanApacheArabArapahoArgentineanArmenianAssyrian/Chaldean/SyriacAustralianAustrianBahamianBangladeshiBarbadianBasqueBelgianBelizeanBermudanBhutaneseBlackfeetBolivianBrazilianBritishBritish West IndianBulgarianBurmeseCajunCambodianCanadianCape VerdeanCarpatho RusynCelticCentral AmericanCentral American IndianCherokeeCheyenneChickasawChileanChineseChippewaChoctawColombianColvilleComancheCosta RicanCreeCreekCroatianCrowCubanCypriotCzechCzechoslovakianDanishDelawareDominicanDutchDutch West IndianEastern EuropeanEcuadorianEgyptianEnglishEstonianEthiopianEuropeanFijianFilipinoFinnishFrenchFrench American IndianFrench CanadianGermanGerman RussianGhanaianGreekGuamanian/ChamorroGuatemalanGuyaneseHaitianHmongHonduranHopiHoumaIcelanderIndian (Asian)IndonesianInupiatIranianIraqiIrishIroquoisIsraeliItalianJamaicanJapaneseJordanianKenyanKiowaKoreanLaotianLatvianLebaneseLiberianLithuanianLumbeeLuxembourgerMacedonianMalaysianMalteseMarshalleseMenomineeMexicanMexican American IndianMongolianMoroccanNative HawaiianNavajoNepaleseNew ZealanderNicaraguanNigerianNorthern EuropeanNorwegianOkinawanOsageOttawaPaiutePakistaniPalestinianPanamanianParaguayanPennsylvania GermanPeruvianPimaPolishPortuguesePotawatomiPuebloPuerto RicanPuget Sound SalishRomanianRussianSalvadoranSamoanScandinavianScotch-IrishScottishSeminoleSenegaleseSerbianShoshoneSierra LeoneanSiouxSlavicSlovakSloveneSomaliSouth AfricanSouth AmericanSouth American IndianSoviet UnionSpaniardSpanishSpanish AmericanSpanish American IndianSri LankanSubsaharan AfricanSudaneseSwedishSwissSyrianTaiwaneseThaiTlingit-HaidaTohono O'OdhamTonganTrinidadian and TobagonianTsimshianTurkishU.S. Virgin IslanderUgandanUkrainianUruguayanUteVenezuelanVietnameseWelshWest IndianYakamaYaquiYugoslavianYumanYup'ikZimbabwean
Immigration
NonimmigrantsImmigrantsAfghanistanAfricaAlbaniaArgentinaArmeniaAsiaAustraliaAustriaBahamasBangladeshBarbadosBelarusBelgiumBelizeBoliviaBosnia and HerzegovinaBrazilBulgariaBurma/MyanmarCabo VerdeCambodiaCameroonCanadaCaribbeanCentral AmericaChileChinaColombiaCongoCosta RicaCroatiaCubaCzechoslovakiaDenmarkDominicaDominican RepublicEastern AfricaEastern AsiaEastern EuropeEcuadorEgyptEl SalvadorEnglandEritreaEthiopiaEuropeFijiFranceGermanyGhanaGreeceGrenadaGuatemalaGuyanaHaitiHondurasHong KongHungaryIndiaIndonesiaIranIraqIrelandIsraelItalyJamaicaJapanJordanKazakhstanKenyaKoreaKuwaitLaosLatin AmericaLatviaLebanonLiberiaLithuaniaMalaysiaMexicoMicronesiaMiddle AfricaMoldovaMoroccoNepalNetherlandsNicaraguaNigeriaNorth AmericaNorth MacedoniaNorthern AfricaNorthern EuropeNorwayOceaniaPakistanPanamaPeruPhilippinesPolandPortugalRomaniaRussiaSaudi ArabiaScotlandSenegalSerbiaSierra LeoneSingaporeSomaliaSouth AfricaSouth AmericaSouth Central AsiaSouth Eastern AsiaSouthern EuropeSpainSri LankaSt. Vincent and the GrenadinesSudanSwedenSwitzerlandSyriaTaiwanThailandTrinidad and TobagoTurkeyUgandaUkraineUruguayUzbekistanVenezuelaVietnamWest IndiesWestern AfricaWestern AsiaWestern EuropeYemenZaireZimbabweAzores
Receiving Food Stamps
Income
Poverty
Unemployment
Labor Participation
Family Structure
Vehicle Availability
Education Level
Disability

Hungarian Receiving Food Stamps
Excellent

11.0%
PUBLIC INCOME | FOOD STAMPS
85.1/ 100
METRIC RATING
145th/ 347
METRIC RANK

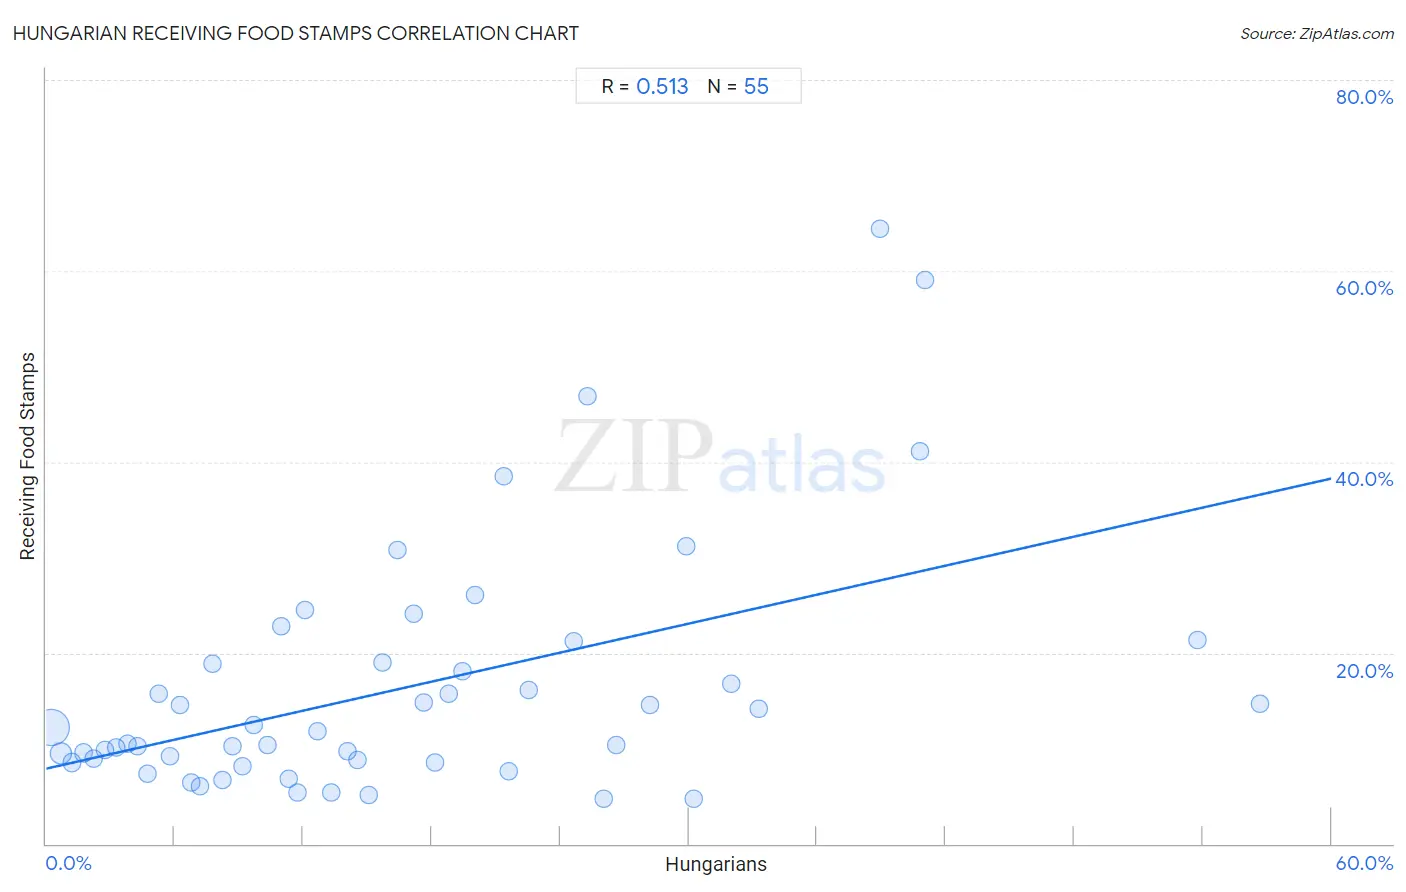
Hungarian Receiving Food Stamps Correlation Chart

The statistical analysis conducted on geographies consisting of 483,983,942 people shows a substantial positive correlation between the proportion of Hungarians and percentage of population receiving government assistance and/or food stamps in the United States with a correlation coefficient (R) of 0.513 and weighted average of 11.0%. On average, for every 1% (one percent) increase in Hungarians within a typical geography, there is an increase of 0.51% in percentage of population receiving government assistance and/or food stamps.
Hungarian Receiving Food Stamps
It is essential to understand that the correlation between the percentage of Hungarians and percentage of population receiving government assistance and/or food stamps does not imply a direct cause-and-effect relationship. It remains uncertain whether the presence of Hungarians influences an upward or downward trend in the level of percentage of population receiving government assistance and/or food stamps within an area, or if Hungarians simply ended up residing in those areas with higher or lower levels of percentage of population receiving government assistance and/or food stamps due to other factors.

Demographics Similar to Hungarians by Receiving Food Stamps

In terms of receiving food stamps, the demographic groups most similar to Hungarians are Syrian (11.0%, a difference of 0.12%), Taiwanese (11.0%, a difference of 0.24%), Immigrants from Northern Africa (11.0%, a difference of 0.27%), White/Caucasian (11.1%, a difference of 0.34%), and Chilean (11.0%, a difference of 0.35%).
DemographicsRating | RankReceiving Food Stamps
Immigrants from Moldova
88.5
/100
|
#138
Excellent
10.9%
Hmong
88.4
/100
|
#139
Excellent
10.9%
Celtics
87.8
/100
|
#140
Excellent
10.9%
Immigrants from Vietnam
86.7
/100
|
#141
Excellent
11.0%
Chileans
86.2
/100
|
#142
Excellent
11.0%
Immigrants from Northern Africa
86.0
/100
|
#143
Excellent
11.0%
Syrians
85.5
/100
|
#144
Excellent
11.0%
Hungarians
85.1
/100
|
#145
Excellent
11.0%
Taiwanese
84.2
/100
|
#146
Excellent
11.0%
Whites/Caucasians
83.9
/100
|
#147
Excellent
11.1%
Immigrants from South Eastern Asia
83.3
/100
|
#148
Excellent
11.1%
Brazilians
83.2
/100
|
#149
Excellent
11.1%
Soviet Union
83.1
/100
|
#150
Excellent
11.1%
Immigrants from Spain
81.7
/100
|
#151
Excellent
11.1%
Immigrants from Kazakhstan
81.7
/100
|
#152
Excellent
11.1%

Hungarian Receiving Food Stamps Correlation Summary

MeasurementHungarian DataReceiving Food Stamps Data
Minimum0.21%4.7%
Maximum56.7%64.4%
Range56.5%59.7%
Mean16.8%16.3%
Median14.0%11.7%
Interquartile 25% (IQ1)6.8%8.5%
Interquartile 75% (IQ3)24.6%19.0%
Interquartile Range (IQR)17.9%10.5%
Standard Deviation (Sample)13.0%12.9%
Standard Deviation (Population)12.9%12.7%

Correlation Details

Hungarian PercentileSample SizeReceiving Food Stamps
[
0.0%
-
0.5%
]
0.21%
356,331,55412.2%
[
0.5%
-
1.0%
]
0.68%
85,314,9419.4%
[
1.0%
-
1.5%
]
1.20%
21,608,0078.5%
[
1.5%
-
2.0%
]
1.73%
8,562,9799.5%
[
2.0%
-
2.5%
]
2.23%
4,028,9238.9%
[
2.5%
-
3.0%
]
2.75%
2,186,9389.8%
[
3.0%
-
3.5%
]
3.25%
1,821,82410.1%
[
3.5%
-
4.0%
]
3.77%
1,288,30210.5%
[
4.0%
-
4.5%
]
4.25%
886,98010.3%
[
4.5%
-
5.0%
]
4.74%
450,1887.4%
[
5.0%
-
5.5%
]
5.28%
437,19915.7%
[
5.5%
-
6.0%
]
5.78%
154,1439.1%
[
6.0%
-
6.5%
]
6.22%
147,16314.5%
[
6.5%
-
7.0%
]
6.77%
116,9166.4%
[
7.0%
-
7.5%
]
7.17%
78,8956.0%
[
7.5%
-
8.0%
]
7.75%
63,21718.9%
[
8.0%
-
8.5%
]
8.22%
45,2706.7%
[
8.5%
-
9.0%
]
8.72%
27,38910.2%
[
9.0%
-
9.5%
]
9.15%
17,6328.2%
[
9.5%
-
10.0%
]
9.71%
10,84012.5%
[
10.0%
-
10.5%
]
10.33%
5,51710.3%
[
10.5%
-
11.0%
]
10.95%
53,69022.8%
[
11.0%
-
11.5%
]
11.30%
25,9796.8%
[
11.5%
-
12.0%
]
11.76%
18,5335.3%
[
12.0%
-
12.5%
]
12.06%
76,80624.4%
[
12.5%
-
13.0%
]
12.66%
2,02211.7%
[
13.0%
-
13.5%
]
13.32%
2,7175.4%
[
14.0%
-
14.5%
]
14.04%
1789.7%
[
14.5%
-
15.0%
]
14.55%
4338.8%
[
15.0%
-
15.5%
]
15.05%
7,0845.1%
[
15.5%
-
16.0%
]
15.69%
10219.0%
[
16.0%
-
16.5%
]
16.42%
6730.8%
[
17.0%
-
17.5%
]
17.14%
48,62724.1%
[
17.5%
-
18.0%
]
17.65%
5114.8%
[
18.0%
-
18.5%
]
18.13%
1,1648.5%
[
18.5%
-
19.0%
]
18.80%
94715.8%
[
19.0%
-
19.5%
]
19.42%
1,79218.1%
[
20.0%
-
20.5%
]
20.00%
3026.1%
[
21.0%
-
21.5%
]
21.35%
28,28738.5%
[
21.5%
-
22.0%
]
21.60%
1,1027.6%
[
22.5%
-
23.0%
]
22.53%
7,38516.1%
[
24.5%
-
25.0%
]
24.63%
64,19321.3%
[
25.0%
-
25.5%
]
25.29%
6,46046.9%
[
26.0%
-
26.5%
]
26.04%
1924.7%
[
26.5%
-
27.0%
]
26.60%
18810.4%
[
28.0%
-
28.5%
]
28.17%
7114.5%
[
29.5%
-
30.0%
]
29.88%
89731.1%
[
30.0%
-
30.5%
]
30.23%
2584.7%
[
31.5%
-
32.0%
]
31.96%
3,85816.7%
[
33.0%
-
33.5%
]
33.30%
87114.1%
[
38.5%
-
39.0%
]
38.95%
9,57864.4%
[
40.5%
-
41.0%
]
40.81%
34,36841.1%
[
41.0%
-
41.5%
]
41.06%
96259.0%
[
53.5%
-
54.0%
]
53.76%
17321.3%
[
56.5%
-
57.0%
]
56.67%
6014.7%