Bhutanese vs Immigrants from Germany Married-Couple Family Poverty

COMPARE

Bhutanese
Race
Ancestry
AfghanAfricanAlaska NativeAlaskan AthabascanAlbanianAleutAlsatianAmericanApacheArabArapahoArgentineanArmenianAssyrian/Chaldean/SyriacAustralianAustrianBahamianBangladeshiBarbadianBasqueBelgianBelizeanBermudanBhutaneseBlackfeetBolivianBrazilianBritishBritish West IndianBulgarianBurmeseCajunCambodianCanadianCape VerdeanCarpatho RusynCelticCentral AmericanCentral American IndianCherokeeCheyenneChickasawChileanChineseChippewaChoctawColombianColvilleComancheCosta RicanCreeCreekCroatianCrowCubanCypriotCzechCzechoslovakianDanishDelawareDominicanDutchDutch West IndianEastern EuropeanEcuadorianEgyptianEnglishEstonianEthiopianEuropeanFijianFilipinoFinnishFrenchFrench American IndianFrench CanadianGermanGerman RussianGhanaianGreekGuamanian/ChamorroGuatemalanGuyaneseHaitianHmongHonduranHopiHoumaHungarianIcelanderIndian (Asian)IndonesianInupiatIranianIraqiIrishIroquoisIsraeliItalianJamaicanJapaneseJordanianKenyanKiowaKoreanLaotianLatvianLebaneseLiberianLithuanianLumbeeLuxembourgerMacedonianMalaysianMalteseMarshalleseMenomineeMexicanMexican American IndianMongolianMoroccanNative HawaiianNavajoNepaleseNew ZealanderNicaraguanNigerianNorthern EuropeanNorwegianOkinawanOsageOttawaPaiutePakistaniPalestinianPanamanianParaguayanPennsylvania GermanPeruvianPimaPolishPortuguesePotawatomiPuebloPuerto RicanPuget Sound SalishRomanianRussianSalvadoranSamoanScandinavianScotch-IrishScottishSeminoleSenegaleseSerbianShoshoneSierra LeoneanSiouxSlavicSlovakSloveneSomaliSouth AfricanSouth AmericanSouth American IndianSoviet UnionSpaniardSpanishSpanish AmericanSpanish American IndianSri LankanSubsaharan AfricanSudaneseSwedishSwissSyrianTaiwaneseThaiTlingit-HaidaTohono O'OdhamTonganTrinidadian and TobagonianTsimshianTurkishU.S. Virgin IslanderUgandanUkrainianUruguayanUteVenezuelanVietnameseWelshWest IndianYakamaYaquiYugoslavianYumanYup'ikZimbabwean
Immigration
NonimmigrantsImmigrantsAfghanistanAfricaAlbaniaArgentinaArmeniaAsiaAustraliaAustriaBahamasBangladeshBarbadosBelarusBelgiumBelizeBoliviaBosnia and HerzegovinaBrazilBulgariaBurma/MyanmarCabo VerdeCambodiaCameroonCanadaCaribbeanCentral AmericaChileChinaColombiaCongoCosta RicaCroatiaCubaCzechoslovakiaDenmarkDominicaDominican RepublicEastern AfricaEastern AsiaEastern EuropeEcuadorEgyptEl SalvadorEnglandEritreaEthiopiaEuropeFijiFranceGhanaGreeceGrenadaGuatemalaGuyanaHaitiHondurasHong KongHungaryIndiaIndonesiaIranIraqIrelandIsraelItalyJamaicaJapanJordanKazakhstanKenyaKoreaKuwaitLaosLatin AmericaLatviaLebanonLiberiaLithuaniaMalaysiaMexicoMicronesiaMiddle AfricaMoldovaMoroccoNepalNetherlandsNicaraguaNigeriaNorth AmericaNorth MacedoniaNorthern AfricaNorthern EuropeNorwayOceaniaPakistanPanamaPeruPhilippinesPolandPortugalRomaniaRussiaSaudi ArabiaScotlandSenegalSerbiaSierra LeoneSingaporeSomaliaSouth AfricaSouth AmericaSouth Central AsiaSouth Eastern AsiaSouthern EuropeSpainSri LankaSt. Vincent and the GrenadinesSudanSwedenSwitzerlandSyriaTaiwanThailandTrinidad and TobagoTurkeyUgandaUkraineUruguayUzbekistanVenezuelaVietnamWest IndiesWestern AfricaWestern AsiaWestern EuropeYemenZaireZimbabweAzores
Immigrants from Germany
Race
Ancestry
AfghanAfricanAlaska NativeAlaskan AthabascanAlbanianAleutAlsatianAmericanApacheArabArapahoArgentineanArmenianAssyrian/Chaldean/SyriacAustralianAustrianBahamianBangladeshiBarbadianBasqueBelgianBelizeanBermudanBlackfeetBolivianBrazilianBritishBritish West IndianBulgarianBurmeseCajunCambodianCanadianCape VerdeanCarpatho RusynCelticCentral AmericanCentral American IndianCherokeeCheyenneChickasawChileanChineseChippewaChoctawColombianColvilleComancheCosta RicanCreeCreekCroatianCrowCubanCypriotCzechCzechoslovakianDanishDelawareDominicanDutchDutch West IndianEastern EuropeanEcuadorianEgyptianEnglishEstonianEthiopianEuropeanFijianFilipinoFinnishFrenchFrench American IndianFrench CanadianGermanGerman RussianGhanaianGreekGuamanian/ChamorroGuatemalanGuyaneseHaitianHmongHonduranHopiHoumaHungarianIcelanderIndian (Asian)IndonesianInupiatIranianIraqiIrishIroquoisIsraeliItalianJamaicanJapaneseJordanianKenyanKiowaKoreanLaotianLatvianLebaneseLiberianLithuanianLumbeeLuxembourgerMacedonianMalaysianMalteseMarshalleseMenomineeMexicanMexican American IndianMongolianMoroccanNative HawaiianNavajoNepaleseNew ZealanderNicaraguanNigerianNorthern EuropeanNorwegianOkinawanOsageOttawaPaiutePakistaniPalestinianPanamanianParaguayanPennsylvania GermanPeruvianPimaPolishPortuguesePotawatomiPuebloPuerto RicanPuget Sound SalishRomanianRussianSalvadoranSamoanScandinavianScotch-IrishScottishSeminoleSenegaleseSerbianShoshoneSierra LeoneanSiouxSlavicSlovakSloveneSomaliSouth AfricanSouth AmericanSouth American IndianSoviet UnionSpaniardSpanishSpanish AmericanSpanish American IndianSri LankanSubsaharan AfricanSudaneseSwedishSwissSyrianTaiwaneseThaiTlingit-HaidaTohono O'OdhamTonganTrinidadian and TobagonianTsimshianTurkishU.S. Virgin IslanderUgandanUkrainianUruguayanUteVenezuelanVietnameseWelshWest IndianYakamaYaquiYugoslavianYumanYup'ikZimbabwean
Immigration
NonimmigrantsImmigrantsAfghanistanAfricaAlbaniaArgentinaArmeniaAsiaAustraliaAustriaBahamasBangladeshBarbadosBelarusBelgiumBelizeBoliviaBosnia and HerzegovinaBrazilBulgariaBurma/MyanmarCabo VerdeCambodiaCameroonCanadaCaribbeanCentral AmericaChileChinaColombiaCongoCosta RicaCroatiaCubaCzechoslovakiaDenmarkDominicaDominican RepublicEastern AfricaEastern AsiaEastern EuropeEcuadorEgyptEl SalvadorEnglandEritreaEthiopiaEuropeFijiFranceGermanyGhanaGreeceGrenadaGuatemalaGuyanaHaitiHondurasHong KongHungaryIndiaIndonesiaIranIraqIrelandIsraelItalyJamaicaJapanJordanKazakhstanKenyaKoreaKuwaitLaosLatin AmericaLatviaLebanonLiberiaLithuaniaMalaysiaMexicoMicronesiaMiddle AfricaMoldovaMoroccoNepalNetherlandsNicaraguaNigeriaNorth AmericaNorth MacedoniaNorthern AfricaNorthern EuropeNorwayOceaniaPakistanPanamaPeruPhilippinesPolandPortugalRomaniaRussiaSaudi ArabiaScotlandSenegalSerbiaSierra LeoneSingaporeSomaliaSouth AfricaSouth AmericaSouth Central AsiaSouth Eastern AsiaSouthern EuropeSpainSri LankaSt. Vincent and the GrenadinesSudanSwedenSwitzerlandSyriaTaiwanThailandTrinidad and TobagoTurkeyUgandaUkraineUruguayUzbekistanVenezuelaVietnamWest IndiesWestern AfricaWestern AsiaWestern EuropeYemenZaireZimbabweAzores
Married-Couple Family Poverty
Income
Poverty
Unemployment
Labor Participation
Family Structure
Vehicle Availability
Education Level
Disability

Married-Couple Family Poverty Comparison

Bhutanese

Immigrants from Germany

Exceptional
Exceptional
4.1%
MARRIED-COUPLE FAMILY POVERTY
99.9/ 100
METRIC RATING
23rd/ 347
METRIC RANK
4.7%
MARRIED-COUPLE FAMILY POVERTY
96.8/ 100
METRIC RATING
107th/ 347
METRIC RANK

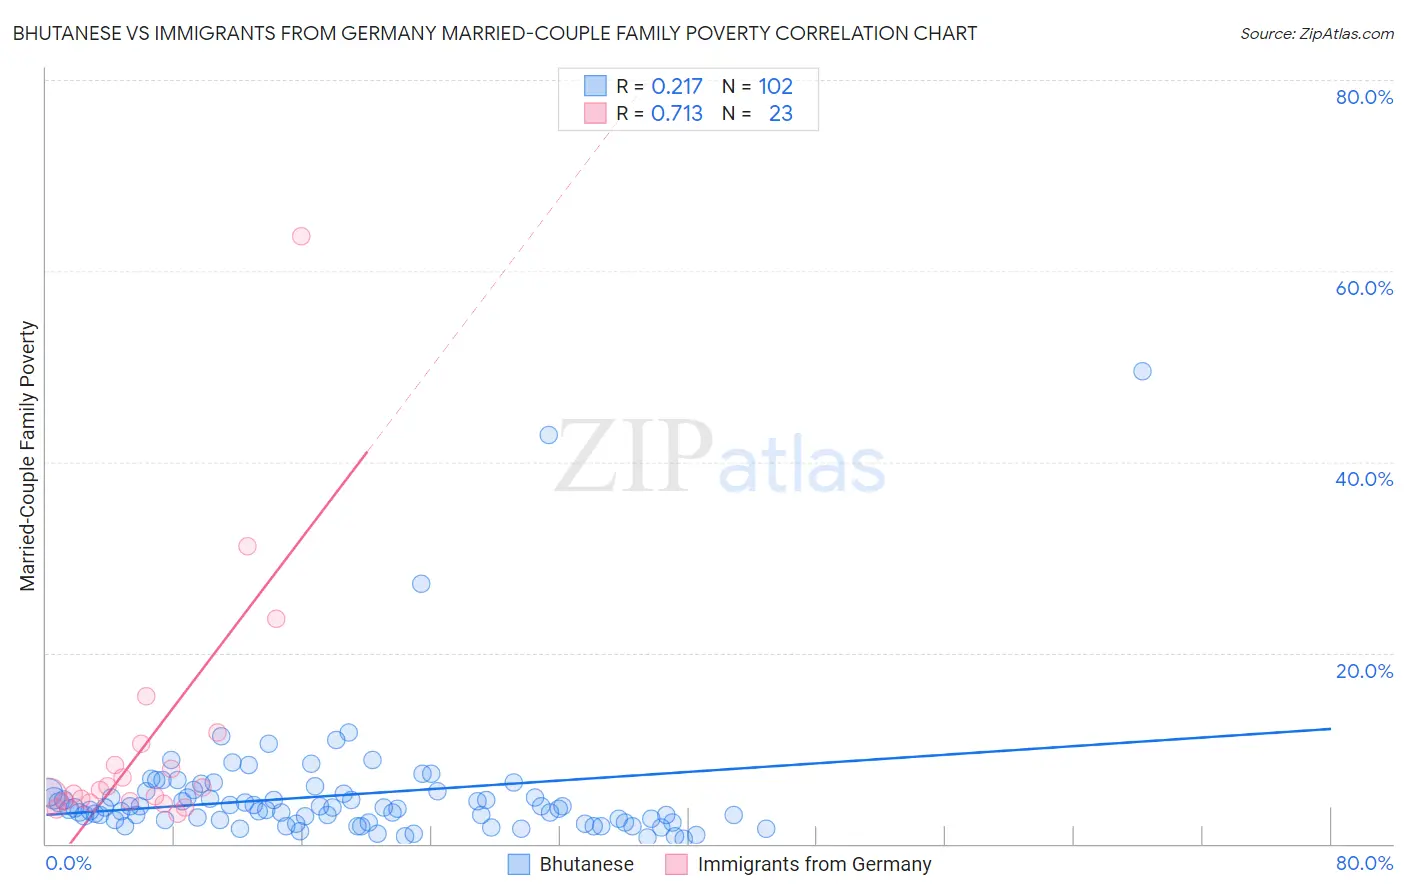
Bhutanese vs Immigrants from Germany Married-Couple Family Poverty Correlation Chart

The statistical analysis conducted on geographies consisting of 450,291,687 people shows a weak positive correlation between the proportion of Bhutanese and poverty level among married-couple families in the United States with a correlation coefficient (R) of 0.217 and weighted average of 4.1%. Similarly, the statistical analysis conducted on geographies consisting of 458,355,071 people shows a strong positive correlation between the proportion of Immigrants from Germany and poverty level among married-couple families in the United States with a correlation coefficient (R) of 0.713 and weighted average of 4.7%, a difference of 14.7%.
Bhutanese vs Immigrants from Germany Married-Couple Family Poverty

Married-Couple Family Poverty Correlation Summary

MeasurementBhutaneseImmigrants from Germany
Minimum0.54%3.1%
Maximum49.5%63.6%
Range48.9%60.5%
Mean5.1%10.6%
Median3.7%5.6%
Interquartile 25% (IQ1)2.4%4.4%
Interquartile 75% (IQ3)5.4%10.5%
Interquartile Range (IQR)3.0%6.1%
Standard Deviation (Sample)6.7%13.4%
Standard Deviation (Population)6.7%13.1%

Similar Demographics by Married-Couple Family Poverty

Demographics Similar to Bhutanese by Married-Couple Family Poverty

In terms of married-couple family poverty, the demographic groups most similar to Bhutanese are Immigrants from Singapore (4.1%, a difference of 0.020%), Eastern European (4.1%, a difference of 0.23%), Zimbabwean (4.1%, a difference of 0.39%), Maltese (4.1%, a difference of 0.42%), and Immigrants from Ireland (4.1%, a difference of 0.66%).
DemographicsRating | RankMarried-Couple Family Poverty
Germans
100.0
/100
|
#16
Exceptional
4.0%
Filipinos
100.0
/100
|
#17
Exceptional
4.0%
Italians
100.0
/100
|
#18
Exceptional
4.0%
Immigrants | Ireland
99.9
/100
|
#19
Exceptional
4.1%
Maltese
99.9
/100
|
#20
Exceptional
4.1%
Zimbabweans
99.9
/100
|
#21
Exceptional
4.1%
Immigrants | Singapore
99.9
/100
|
#22
Exceptional
4.1%
Bhutanese
99.9
/100
|
#23
Exceptional
4.1%
Eastern Europeans
99.9
/100
|
#24
Exceptional
4.1%
Immigrants | Taiwan
99.9
/100
|
#25
Exceptional
4.1%
Cypriots
99.9
/100
|
#26
Exceptional
4.1%
Danes
99.9
/100
|
#27
Exceptional
4.1%
Scandinavians
99.9
/100
|
#28
Exceptional
4.1%
Immigrants | Scotland
99.9
/100
|
#29
Exceptional
4.2%
Finns
99.9
/100
|
#30
Exceptional
4.2%

Demographics Similar to Immigrants from Germany by Married-Couple Family Poverty

In terms of married-couple family poverty, the demographic groups most similar to Immigrants from Germany are Immigrants from France (4.7%, a difference of 0.010%), Aleut (4.7%, a difference of 0.16%), Immigrants from Moldova (4.7%, a difference of 0.24%), Laotian (4.7%, a difference of 0.26%), and Immigrants from Hong Kong (4.7%, a difference of 0.46%).
DemographicsRating | RankMarried-Couple Family Poverty
Immigrants | Western Europe
97.9
/100
|
#100
Exceptional
4.6%
Yugoslavians
97.8
/100
|
#101
Exceptional
4.6%
Asians
97.6
/100
|
#102
Exceptional
4.7%
Immigrants | Romania
97.3
/100
|
#103
Exceptional
4.7%
Immigrants | Moldova
97.1
/100
|
#104
Exceptional
4.7%
Aleuts
97.0
/100
|
#105
Exceptional
4.7%
Immigrants | France
96.9
/100
|
#106
Exceptional
4.7%
Immigrants | Germany
96.8
/100
|
#107
Exceptional
4.7%
Laotians
96.6
/100
|
#108
Exceptional
4.7%
Immigrants | Hong Kong
96.4
/100
|
#109
Exceptional
4.7%
Immigrants | Bolivia
96.2
/100
|
#110
Exceptional
4.7%
Pakistanis
96.2
/100
|
#111
Exceptional
4.7%
Tongans
95.9
/100
|
#112
Exceptional
4.7%
Immigrants | Nepal
95.9
/100
|
#113
Exceptional
4.7%
Immigrants | Indonesia
95.1
/100
|
#114
Exceptional
4.8%