Panamanian vs Immigrants from Hungary 4 or more Vehicles in Household
COMPARE
Panamanian
Immigrants from Hungary
4 or more Vehicles in Household
4 or more Vehicles in Household Comparison
Panamanians
Immigrants from Hungary
6.0%
4 OR MORE VEHICLES IN HOUSEHOLD
14.8/ 100
METRIC RATING
211th/ 347
METRIC RANK
5.8%
4 OR MORE VEHICLES IN HOUSEHOLD
4.6/ 100
METRIC RATING
235th/ 347
METRIC RANK
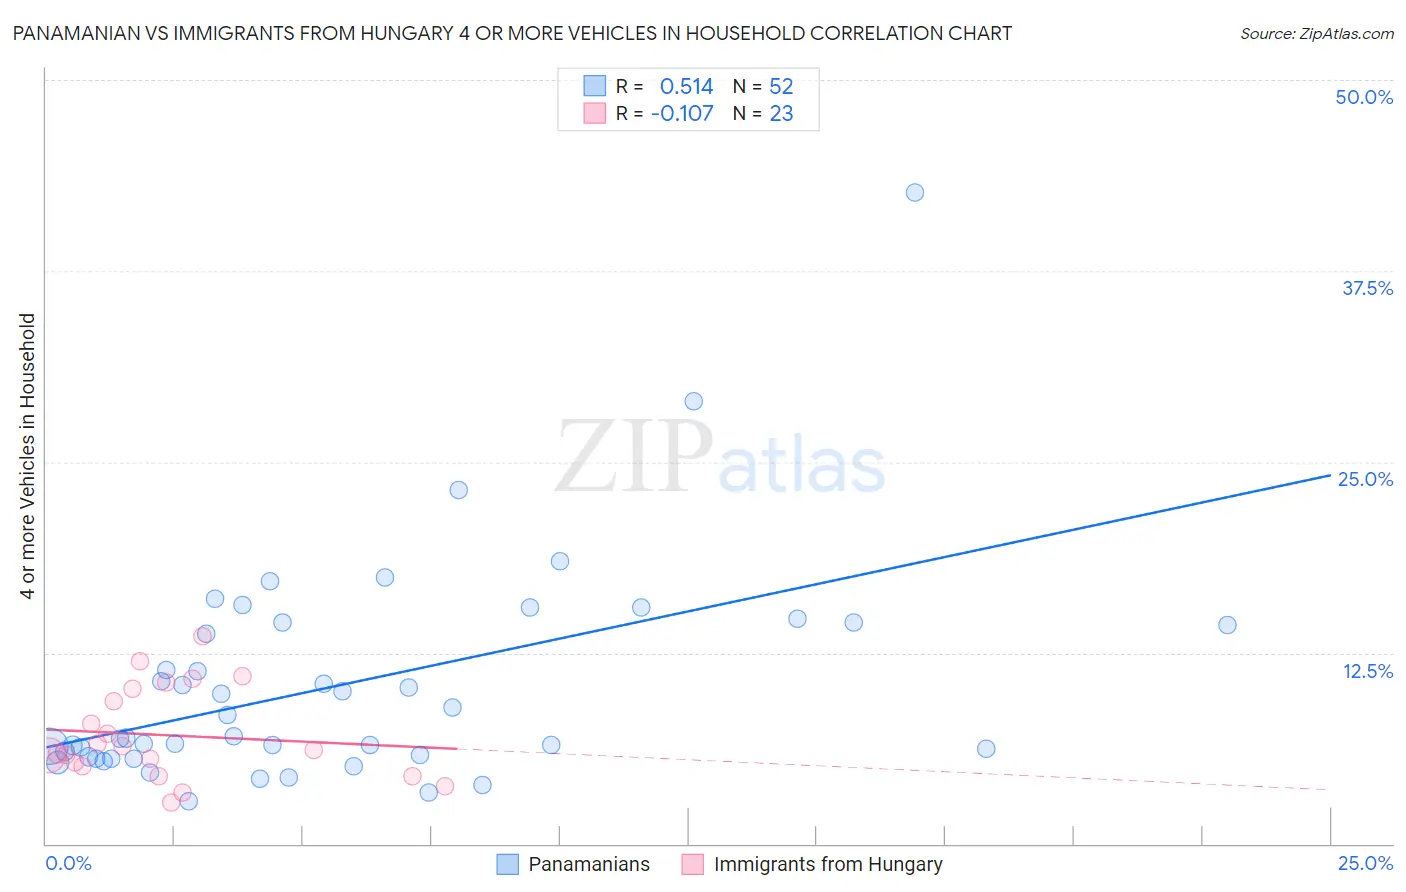
Panamanian vs Immigrants from Hungary 4 or more Vehicles in Household Correlation Chart
The statistical analysis conducted on geographies consisting of 279,879,359 people shows a substantial positive correlation between the proportion of Panamanians and percentage of households with 4 or more vehicles available in the United States with a correlation coefficient (R) of 0.514 and weighted average of 6.0%. Similarly, the statistical analysis conducted on geographies consisting of 194,934,489 people shows a poor negative correlation between the proportion of Immigrants from Hungary and percentage of households with 4 or more vehicles available in the United States with a correlation coefficient (R) of -0.107 and weighted average of 5.8%, a difference of 3.5%.
4 or more Vehicles in Household Correlation Summary
| Measurement | Panamanian | Immigrants from Hungary |
| Minimum | 2.8% | 2.7% |
| Maximum | 42.6% | 13.6% |
| Range | 39.9% | 10.9% |
| Mean | 10.3% | 7.1% |
| Median | 7.0% | 6.2% |
| Interquartile 25% (IQ1) | 5.7% | 5.1% |
| Interquartile 75% (IQ3) | 14.4% | 10.2% |
| Interquartile Range (IQR) | 8.7% | 5.1% |
| Standard Deviation (Sample) | 7.1% | 3.0% |
| Standard Deviation (Population) | 7.0% | 2.9% |
Similar Demographics by 4 or more Vehicles in Household
Demographics Similar to Panamanians by 4 or more Vehicles in Household
In terms of 4 or more vehicles in household, the demographic groups most similar to Panamanians are Immigrants from Egypt (6.0%, a difference of 0.020%), Immigrants from Zimbabwe (6.0%, a difference of 0.080%), Arab (6.0%, a difference of 0.080%), Immigrants from Austria (6.0%, a difference of 0.090%), and Immigrants from Honduras (6.1%, a difference of 0.13%).
| Demographics | Rating | Rank | 4 or more Vehicles in Household |
| Immigrants | Belize | 19.8 /100 | #204 | Poor 6.1% |
| Hondurans | 19.3 /100 | #205 | Poor 6.1% |
| Kenyans | 18.5 /100 | #206 | Poor 6.1% |
| Immigrants | Chile | 16.9 /100 | #207 | Poor 6.1% |
| Immigrants | Nigeria | 15.6 /100 | #208 | Poor 6.1% |
| Immigrants | Honduras | 15.4 /100 | #209 | Poor 6.1% |
| Immigrants | Zimbabwe | 15.1 /100 | #210 | Poor 6.0% |
| Panamanians | 14.8 /100 | #211 | Poor 6.0% |
| Immigrants | Egypt | 14.7 /100 | #212 | Poor 6.0% |
| Arabs | 14.4 /100 | #213 | Poor 6.0% |
| Immigrants | Austria | 14.3 /100 | #214 | Poor 6.0% |
| Immigrants | China | 13.8 /100 | #215 | Poor 6.0% |
| Immigrants | Romania | 13.8 /100 | #216 | Poor 6.0% |
| Nigerians | 12.2 /100 | #217 | Poor 6.0% |
| Immigrants | Italy | 11.0 /100 | #218 | Poor 6.0% |
Demographics Similar to Immigrants from Hungary by 4 or more Vehicles in Household
In terms of 4 or more vehicles in household, the demographic groups most similar to Immigrants from Hungary are Immigrants from Eritrea (5.8%, a difference of 0.010%), African (5.8%, a difference of 0.020%), Turkish (5.8%, a difference of 0.29%), Immigrants from Belgium (5.8%, a difference of 0.41%), and Immigrants from Australia (5.8%, a difference of 0.51%).
| Demographics | Rating | Rank | 4 or more Vehicles in Household |
| Immigrants | Uganda | 7.5 /100 | #228 | Tragic 5.9% |
| Eastern Europeans | 6.8 /100 | #229 | Tragic 5.9% |
| Immigrants | Malaysia | 6.7 /100 | #230 | Tragic 5.9% |
| Immigrants | Switzerland | 6.4 /100 | #231 | Tragic 5.9% |
| Immigrants | Argentina | 6.0 /100 | #232 | Tragic 5.9% |
| Sierra Leoneans | 6.0 /100 | #233 | Tragic 5.9% |
| Africans | 4.6 /100 | #234 | Tragic 5.8% |
| Immigrants | Hungary | 4.6 /100 | #235 | Tragic 5.8% |
| Immigrants | Eritrea | 4.5 /100 | #236 | Tragic 5.8% |
| Turks | 4.1 /100 | #237 | Tragic 5.8% |
| Immigrants | Belgium | 4.0 /100 | #238 | Tragic 5.8% |
| Immigrants | Australia | 3.8 /100 | #239 | Tragic 5.8% |
| Immigrants | Poland | 3.8 /100 | #240 | Tragic 5.8% |
| Mongolians | 3.7 /100 | #241 | Tragic 5.8% |
| Immigrants | Middle Africa | 3.4 /100 | #242 | Tragic 5.8% |