Native Hawaiian vs Immigrants from Albania 4 or more Vehicles in Household
COMPARE
Native Hawaiian
Immigrants from Albania
4 or more Vehicles in Household
4 or more Vehicles in Household Comparison
Native Hawaiians
Immigrants from Albania
9.4%
4 OR MORE VEHICLES IN HOUSEHOLD
100.0/ 100
METRIC RATING
7th/ 347
METRIC RANK
4.1%
4 OR MORE VEHICLES IN HOUSEHOLD
0.0/ 100
METRIC RATING
333rd/ 347
METRIC RANK
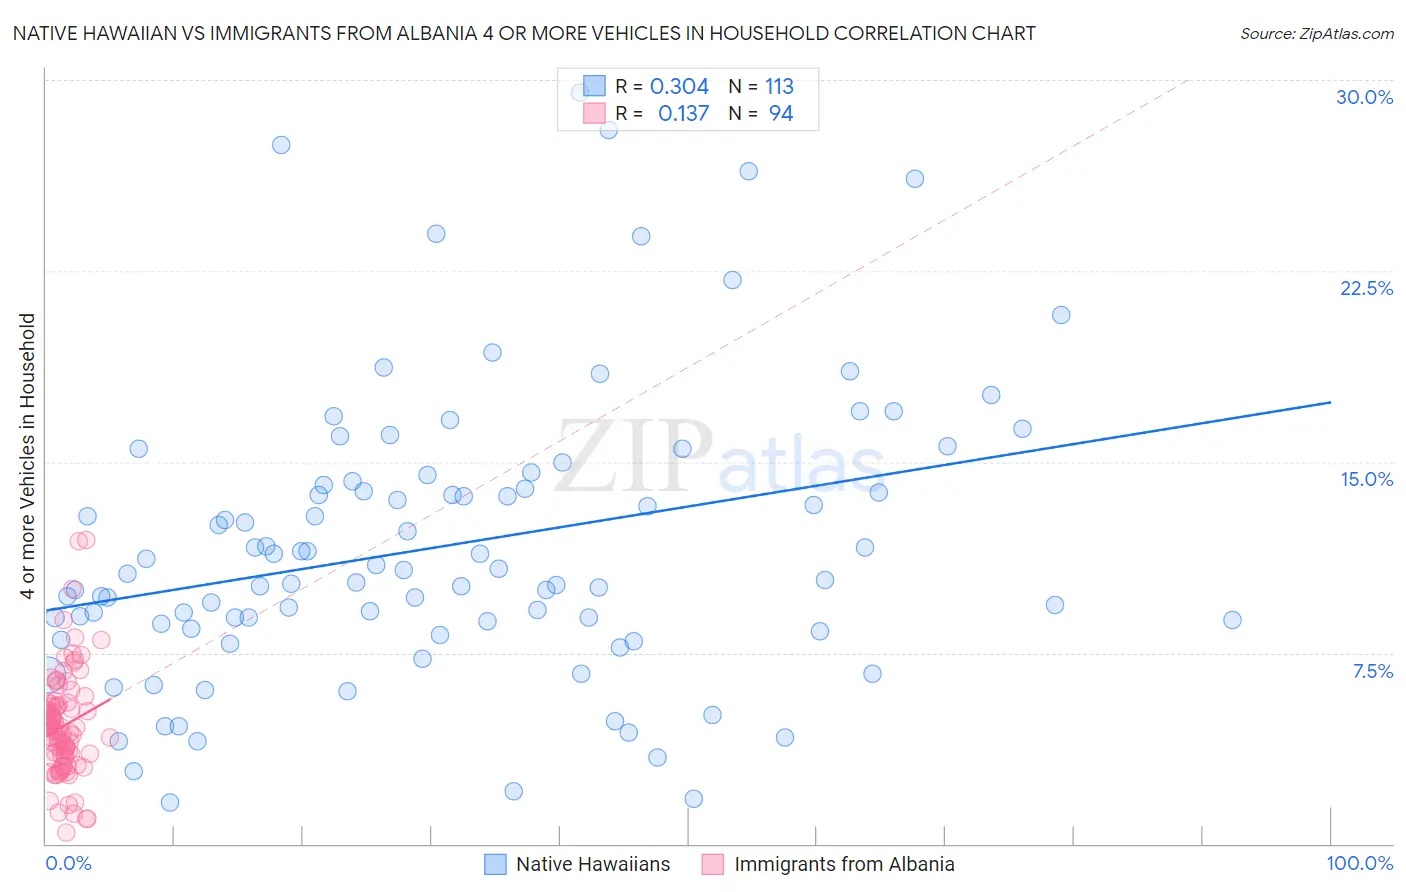
Native Hawaiian vs Immigrants from Albania 4 or more Vehicles in Household Correlation Chart
The statistical analysis conducted on geographies consisting of 330,999,205 people shows a mild positive correlation between the proportion of Native Hawaiians and percentage of households with 4 or more vehicles available in the United States with a correlation coefficient (R) of 0.304 and weighted average of 9.4%. Similarly, the statistical analysis conducted on geographies consisting of 118,698,484 people shows a poor positive correlation between the proportion of Immigrants from Albania and percentage of households with 4 or more vehicles available in the United States with a correlation coefficient (R) of 0.137 and weighted average of 4.1%, a difference of 128.1%.
4 or more Vehicles in Household Correlation Summary
| Measurement | Native Hawaiian | Immigrants from Albania |
| Minimum | 1.6% | 0.42% |
| Maximum | 29.5% | 12.0% |
| Range | 27.9% | 11.5% |
| Mean | 11.7% | 4.6% |
| Median | 10.6% | 4.5% |
| Interquartile 25% (IQ1) | 8.5% | 3.4% |
| Interquartile 75% (IQ3) | 14.2% | 5.5% |
| Interquartile Range (IQR) | 5.6% | 2.1% |
| Standard Deviation (Sample) | 5.7% | 2.1% |
| Standard Deviation (Population) | 5.6% | 2.1% |
Similar Demographics by 4 or more Vehicles in Household
Demographics Similar to Native Hawaiians by 4 or more Vehicles in Household
In terms of 4 or more vehicles in household, the demographic groups most similar to Native Hawaiians are Puget Sound Salish (9.4%, a difference of 0.020%), Arapaho (9.4%, a difference of 0.39%), Samoan (9.2%, a difference of 1.8%), Immigrants from Fiji (9.6%, a difference of 2.6%), and Paiute (9.0%, a difference of 4.2%).
| Demographics | Rating | Rank | 4 or more Vehicles in Household |
| Yakama | 100 /100 | #1 | Exceptional 12.9% |
| Colville | 100.0 /100 | #2 | Exceptional 11.1% |
| Spanish American Indians | 100.0 /100 | #3 | Exceptional 10.8% |
| Tongans | 100.0 /100 | #4 | Exceptional 10.0% |
| Immigrants | Fiji | 100.0 /100 | #5 | Exceptional 9.6% |
| Puget Sound Salish | 100.0 /100 | #6 | Exceptional 9.4% |
| Native Hawaiians | 100.0 /100 | #7 | Exceptional 9.4% |
| Arapaho | 100.0 /100 | #8 | Exceptional 9.4% |
| Samoans | 100.0 /100 | #9 | Exceptional 9.2% |
| Paiute | 100.0 /100 | #10 | Exceptional 9.0% |
| Immigrants | Mexico | 100.0 /100 | #11 | Exceptional 9.0% |
| Mexicans | 100.0 /100 | #12 | Exceptional 8.9% |
| Hawaiians | 100.0 /100 | #13 | Exceptional 8.9% |
| Chinese | 100.0 /100 | #14 | Exceptional 8.8% |
| Shoshone | 100.0 /100 | #15 | Exceptional 8.8% |
Demographics Similar to Immigrants from Albania by 4 or more Vehicles in Household
In terms of 4 or more vehicles in household, the demographic groups most similar to Immigrants from Albania are Immigrants from Trinidad and Tobago (4.1%, a difference of 0.21%), Immigrants from Dominica (4.2%, a difference of 1.7%), West Indian (4.2%, a difference of 2.6%), Immigrants from Ecuador (4.2%, a difference of 2.9%), and Immigrants from Senegal (4.2%, a difference of 3.1%).
| Demographics | Rating | Rank | 4 or more Vehicles in Household |
| Cape Verdeans | 0.0 /100 | #326 | Tragic 4.4% |
| Senegalese | 0.0 /100 | #327 | Tragic 4.3% |
| Trinidadians and Tobagonians | 0.0 /100 | #328 | Tragic 4.3% |
| Immigrants | Senegal | 0.0 /100 | #329 | Tragic 4.2% |
| Immigrants | Ecuador | 0.0 /100 | #330 | Tragic 4.2% |
| West Indians | 0.0 /100 | #331 | Tragic 4.2% |
| Immigrants | Dominica | 0.0 /100 | #332 | Tragic 4.2% |
| Immigrants | Albania | 0.0 /100 | #333 | Tragic 4.1% |
| Immigrants | Trinidad and Tobago | 0.0 /100 | #334 | Tragic 4.1% |
| Barbadians | 0.0 /100 | #335 | Tragic 3.9% |
| Immigrants | Bangladesh | 0.0 /100 | #336 | Tragic 3.9% |
| Vietnamese | 0.0 /100 | #337 | Tragic 3.9% |
| Immigrants | Cabo Verde | 0.0 /100 | #338 | Tragic 3.8% |
| Immigrants | Uzbekistan | 0.0 /100 | #339 | Tragic 3.6% |
| Immigrants | Barbados | 0.0 /100 | #340 | Tragic 3.6% |