Immigrants from Western Africa vs Hopi 4 or more Vehicles in Household
COMPARE
Immigrants from Western Africa
Hopi
4 or more Vehicles in Household
4 or more Vehicles in Household Comparison
Immigrants from Western Africa
Hopi
5.4%
4 OR MORE VEHICLES IN HOUSEHOLD
0.3/ 100
METRIC RATING
281st/ 347
METRIC RANK
6.9%
4 OR MORE VEHICLES IN HOUSEHOLD
97.0/ 100
METRIC RATING
112th/ 347
METRIC RANK
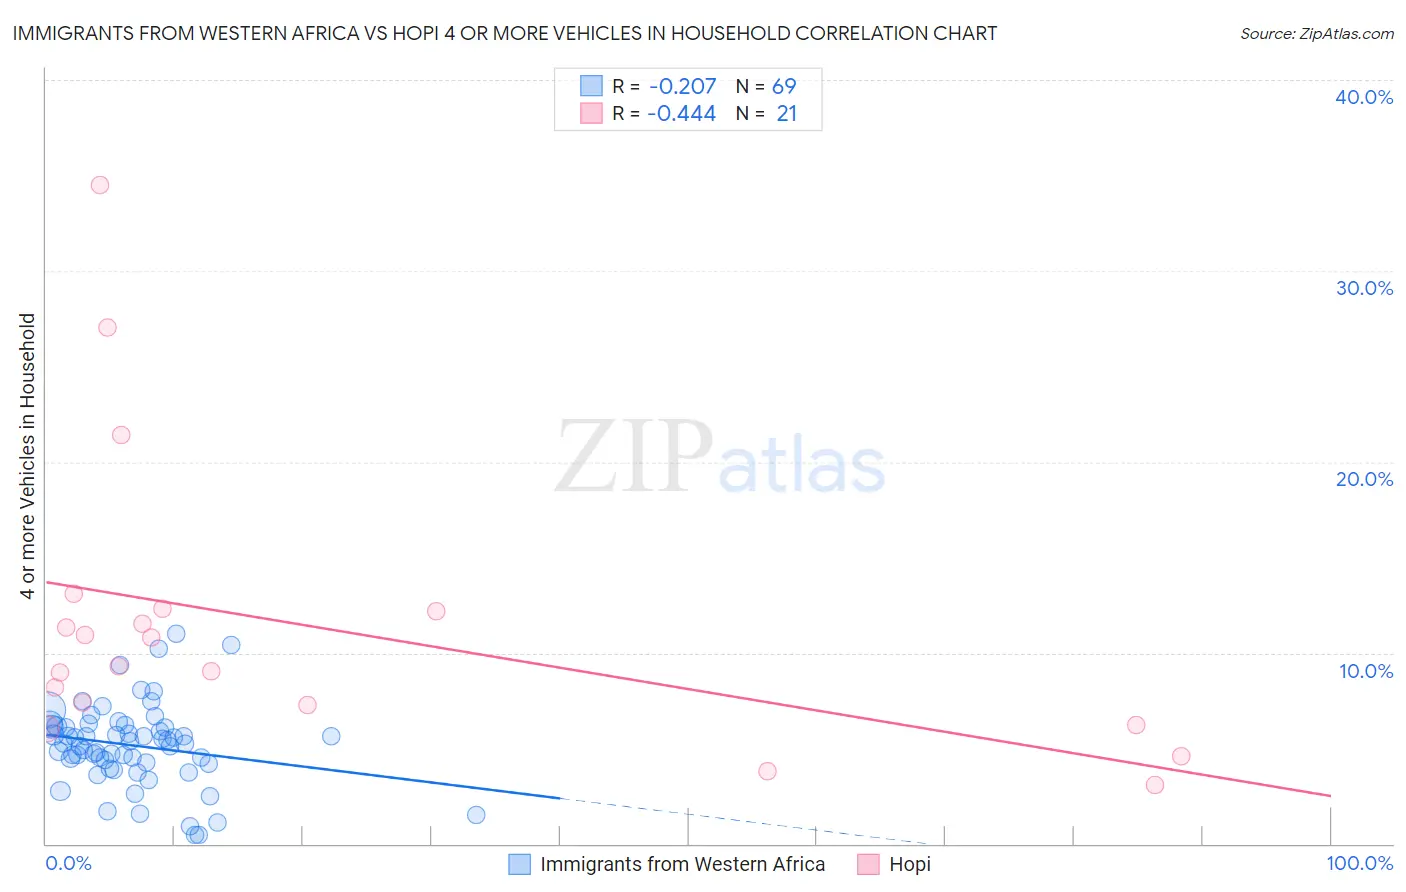
Immigrants from Western Africa vs Hopi 4 or more Vehicles in Household Correlation Chart
The statistical analysis conducted on geographies consisting of 355,941,999 people shows a weak negative correlation between the proportion of Immigrants from Western Africa and percentage of households with 4 or more vehicles available in the United States with a correlation coefficient (R) of -0.207 and weighted average of 5.4%. Similarly, the statistical analysis conducted on geographies consisting of 74,704,966 people shows a moderate negative correlation between the proportion of Hopi and percentage of households with 4 or more vehicles available in the United States with a correlation coefficient (R) of -0.444 and weighted average of 6.9%, a difference of 27.3%.
4 or more Vehicles in Household Correlation Summary
| Measurement | Immigrants from Western Africa | Hopi |
| Minimum | 0.47% | 3.0% |
| Maximum | 11.0% | 34.5% |
| Range | 10.5% | 31.5% |
| Mean | 5.1% | 11.4% |
| Median | 5.3% | 9.3% |
| Interquartile 25% (IQ1) | 4.2% | 6.8% |
| Interquartile 75% (IQ3) | 6.2% | 12.2% |
| Interquartile Range (IQR) | 2.0% | 5.5% |
| Standard Deviation (Sample) | 2.1% | 7.7% |
| Standard Deviation (Population) | 2.1% | 7.5% |
Similar Demographics by 4 or more Vehicles in Household
Demographics Similar to Immigrants from Western Africa by 4 or more Vehicles in Household
In terms of 4 or more vehicles in household, the demographic groups most similar to Immigrants from Western Africa are Alsatian (5.4%, a difference of 0.070%), Immigrants from Uruguay (5.4%, a difference of 0.080%), Immigrants from Spain (5.4%, a difference of 0.17%), Immigrants from Ireland (5.4%, a difference of 0.25%), and Immigrants from Eastern Europe (5.4%, a difference of 0.54%).
| Demographics | Rating | Rank | 4 or more Vehicles in Household |
| Blacks/African Americans | 0.6 /100 | #274 | Tragic 5.5% |
| Cambodians | 0.5 /100 | #275 | Tragic 5.5% |
| Immigrants | Latvia | 0.5 /100 | #276 | Tragic 5.5% |
| Immigrants | Bulgaria | 0.5 /100 | #277 | Tragic 5.5% |
| Immigrants | Eastern Europe | 0.4 /100 | #278 | Tragic 5.4% |
| Immigrants | Uruguay | 0.3 /100 | #279 | Tragic 5.4% |
| Alsatians | 0.3 /100 | #280 | Tragic 5.4% |
| Immigrants | Western Africa | 0.3 /100 | #281 | Tragic 5.4% |
| Immigrants | Spain | 0.3 /100 | #282 | Tragic 5.4% |
| Immigrants | Ireland | 0.3 /100 | #283 | Tragic 5.4% |
| Brazilians | 0.3 /100 | #284 | Tragic 5.4% |
| Immigrants | Liberia | 0.2 /100 | #285 | Tragic 5.4% |
| Immigrants | Colombia | 0.2 /100 | #286 | Tragic 5.4% |
| Immigrants | Croatia | 0.2 /100 | #287 | Tragic 5.4% |
| Venezuelans | 0.2 /100 | #288 | Tragic 5.3% |
Demographics Similar to Hopi by 4 or more Vehicles in Household
In terms of 4 or more vehicles in household, the demographic groups most similar to Hopi are Aleut (6.9%, a difference of 0.010%), Immigrants from Thailand (6.9%, a difference of 0.030%), Canadian (6.9%, a difference of 0.42%), Bolivian (6.8%, a difference of 0.47%), and Tlingit-Haida (6.8%, a difference of 0.53%).
| Demographics | Rating | Rank | 4 or more Vehicles in Household |
| German Russians | 98.3 /100 | #105 | Exceptional 7.0% |
| Guatemalans | 98.1 /100 | #106 | Exceptional 7.0% |
| Nicaraguans | 98.0 /100 | #107 | Exceptional 7.0% |
| French | 97.7 /100 | #108 | Exceptional 6.9% |
| Filipinos | 97.6 /100 | #109 | Exceptional 6.9% |
| Immigrants | Thailand | 97.0 /100 | #110 | Exceptional 6.9% |
| Aleuts | 97.0 /100 | #111 | Exceptional 6.9% |
| Hopi | 97.0 /100 | #112 | Exceptional 6.9% |
| Canadians | 96.4 /100 | #113 | Exceptional 6.9% |
| Bolivians | 96.3 /100 | #114 | Exceptional 6.8% |
| Tlingit-Haida | 96.2 /100 | #115 | Exceptional 6.8% |
| Immigrants | Guatemala | 95.8 /100 | #116 | Exceptional 6.8% |
| Burmese | 95.7 /100 | #117 | Exceptional 6.8% |
| French American Indians | 95.7 /100 | #118 | Exceptional 6.8% |
| Costa Ricans | 95.5 /100 | #119 | Exceptional 6.8% |