Immigrants from Turkey vs Albanian 4 or more Vehicles in Household
COMPARE
Immigrants from Turkey
Albanian
4 or more Vehicles in Household
4 or more Vehicles in Household Comparison
Immigrants from Turkey
Albanians
5.7%
4 OR MORE VEHICLES IN HOUSEHOLD
1.5/ 100
METRIC RATING
256th/ 347
METRIC RANK
4.8%
4 OR MORE VEHICLES IN HOUSEHOLD
0.0/ 100
METRIC RATING
312th/ 347
METRIC RANK
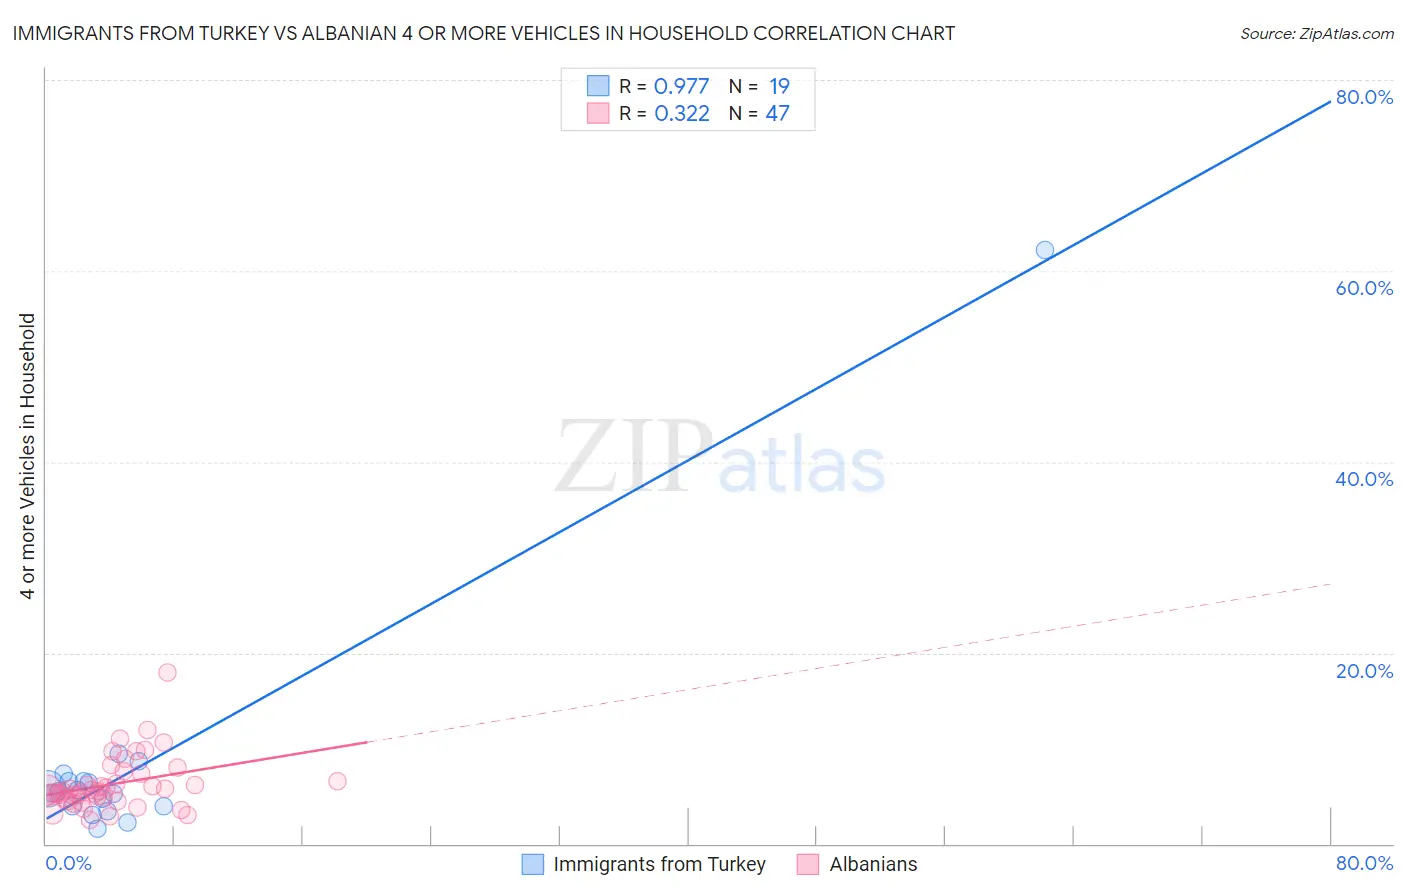
Immigrants from Turkey vs Albanian 4 or more Vehicles in Household Correlation Chart
The statistical analysis conducted on geographies consisting of 222,044,575 people shows a perfect positive correlation between the proportion of Immigrants from Turkey and percentage of households with 4 or more vehicles available in the United States with a correlation coefficient (R) of 0.977 and weighted average of 5.7%. Similarly, the statistical analysis conducted on geographies consisting of 192,343,079 people shows a mild positive correlation between the proportion of Albanians and percentage of households with 4 or more vehicles available in the United States with a correlation coefficient (R) of 0.322 and weighted average of 4.8%, a difference of 18.1%.
4 or more Vehicles in Household Correlation Summary
| Measurement | Immigrants from Turkey | Albanian |
| Minimum | 1.5% | 2.5% |
| Maximum | 62.2% | 18.0% |
| Range | 60.6% | 15.5% |
| Mean | 8.3% | 6.3% |
| Median | 5.5% | 5.5% |
| Interquartile 25% (IQ1) | 3.9% | 4.7% |
| Interquartile 75% (IQ3) | 6.6% | 7.3% |
| Interquartile Range (IQR) | 2.6% | 2.5% |
| Standard Deviation (Sample) | 13.2% | 2.8% |
| Standard Deviation (Population) | 12.9% | 2.8% |
Similar Demographics by 4 or more Vehicles in Household
Demographics Similar to Immigrants from Turkey by 4 or more Vehicles in Household
In terms of 4 or more vehicles in household, the demographic groups most similar to Immigrants from Turkey are Yup'ik (5.7%, a difference of 0.040%), Immigrants from Northern Africa (5.6%, a difference of 0.080%), Immigrants from Panama (5.7%, a difference of 0.12%), Immigrants from Lithuania (5.6%, a difference of 0.22%), and Immigrants from France (5.6%, a difference of 0.25%).
| Demographics | Rating | Rank | 4 or more Vehicles in Household |
| Immigrants | Southern Europe | 2.3 /100 | #249 | Tragic 5.7% |
| Immigrants | Europe | 2.3 /100 | #250 | Tragic 5.7% |
| Ugandans | 2.2 /100 | #251 | Tragic 5.7% |
| Sub-Saharan Africans | 2.1 /100 | #252 | Tragic 5.7% |
| Immigrants | Cuba | 1.6 /100 | #253 | Tragic 5.7% |
| Immigrants | Panama | 1.5 /100 | #254 | Tragic 5.7% |
| Yup'ik | 1.5 /100 | #255 | Tragic 5.7% |
| Immigrants | Turkey | 1.5 /100 | #256 | Tragic 5.7% |
| Immigrants | Northern Africa | 1.4 /100 | #257 | Tragic 5.6% |
| Immigrants | Lithuania | 1.4 /100 | #258 | Tragic 5.6% |
| Immigrants | France | 1.3 /100 | #259 | Tragic 5.6% |
| Uruguayans | 1.3 /100 | #260 | Tragic 5.6% |
| Sudanese | 1.2 /100 | #261 | Tragic 5.6% |
| Bermudans | 1.2 /100 | #262 | Tragic 5.6% |
| Immigrants | Saudi Arabia | 1.1 /100 | #263 | Tragic 5.6% |
Demographics Similar to Albanians by 4 or more Vehicles in Household
In terms of 4 or more vehicles in household, the demographic groups most similar to Albanians are Immigrants from Israel (4.8%, a difference of 0.010%), Immigrants from West Indies (4.7%, a difference of 0.81%), Immigrants from Belarus (4.7%, a difference of 0.90%), Puerto Rican (4.7%, a difference of 1.3%), and Houma (4.9%, a difference of 2.7%).
| Demographics | Rating | Rank | 4 or more Vehicles in Household |
| Somalis | 0.0 /100 | #305 | Tragic 5.0% |
| Immigrants | Serbia | 0.0 /100 | #306 | Tragic 5.0% |
| Menominee | 0.0 /100 | #307 | Tragic 5.0% |
| Paraguayans | 0.0 /100 | #308 | Tragic 4.9% |
| Immigrants | Somalia | 0.0 /100 | #309 | Tragic 4.9% |
| Moroccans | 0.0 /100 | #310 | Tragic 4.9% |
| Houma | 0.0 /100 | #311 | Tragic 4.9% |
| Albanians | 0.0 /100 | #312 | Tragic 4.8% |
| Immigrants | Israel | 0.0 /100 | #313 | Tragic 4.8% |
| Immigrants | West Indies | 0.0 /100 | #314 | Tragic 4.7% |
| Immigrants | Belarus | 0.0 /100 | #315 | Tragic 4.7% |
| Puerto Ricans | 0.0 /100 | #316 | Tragic 4.7% |
| U.S. Virgin Islanders | 0.0 /100 | #317 | Tragic 4.6% |
| Jamaicans | 0.0 /100 | #318 | Tragic 4.6% |
| Haitians | 0.0 /100 | #319 | Tragic 4.6% |