Immigrants from Micronesia vs Asian 4 or more Vehicles in Household
COMPARE
Immigrants from Micronesia
Asian
4 or more Vehicles in Household
4 or more Vehicles in Household Comparison
Immigrants from Micronesia
Asians
7.6%
4 OR MORE VEHICLES IN HOUSEHOLD
100.0/ 100
METRIC RATING
63rd/ 347
METRIC RANK
7.0%
4 OR MORE VEHICLES IN HOUSEHOLD
98.6/ 100
METRIC RATING
102nd/ 347
METRIC RANK
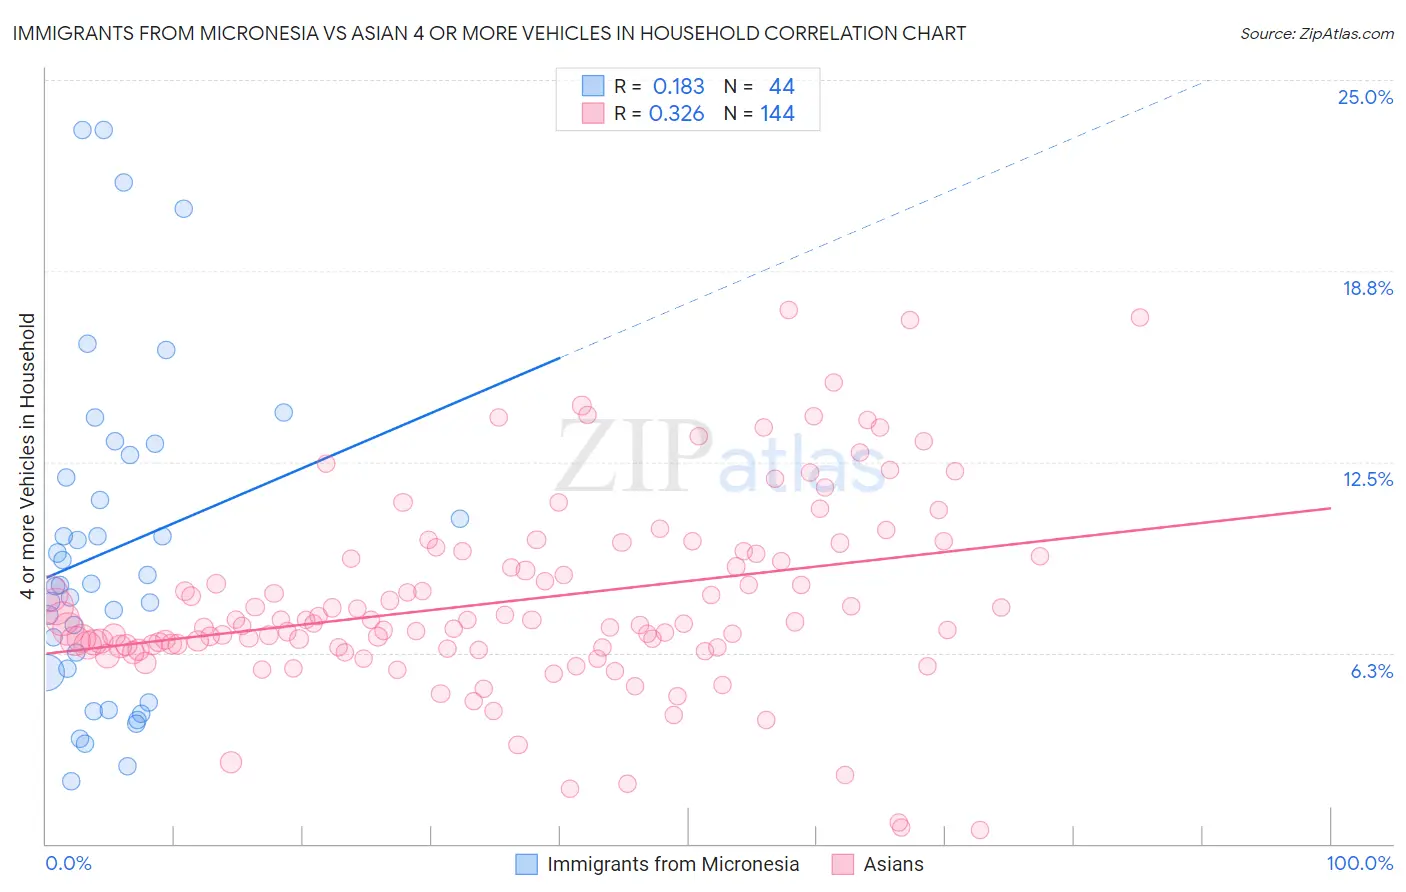
Immigrants from Micronesia vs Asian 4 or more Vehicles in Household Correlation Chart
The statistical analysis conducted on geographies consisting of 61,547,693 people shows a poor positive correlation between the proportion of Immigrants from Micronesia and percentage of households with 4 or more vehicles available in the United States with a correlation coefficient (R) of 0.183 and weighted average of 7.6%. Similarly, the statistical analysis conducted on geographies consisting of 547,642,894 people shows a mild positive correlation between the proportion of Asians and percentage of households with 4 or more vehicles available in the United States with a correlation coefficient (R) of 0.326 and weighted average of 7.0%, a difference of 8.0%.
4 or more Vehicles in Household Correlation Summary
| Measurement | Immigrants from Micronesia | Asian |
| Minimum | 2.1% | 0.45% |
| Maximum | 23.4% | 17.5% |
| Range | 21.3% | 17.0% |
| Mean | 9.6% | 7.9% |
| Median | 8.5% | 7.2% |
| Interquartile 25% (IQ1) | 5.7% | 6.4% |
| Interquartile 75% (IQ3) | 12.4% | 9.5% |
| Interquartile Range (IQR) | 6.7% | 3.0% |
| Standard Deviation (Sample) | 5.4% | 3.1% |
| Standard Deviation (Population) | 5.3% | 3.1% |
Similar Demographics by 4 or more Vehicles in Household
Demographics Similar to Immigrants from Micronesia by 4 or more Vehicles in Household
In terms of 4 or more vehicles in household, the demographic groups most similar to Immigrants from Micronesia are Chippewa (7.6%, a difference of 0.010%), Bangladeshi (7.6%, a difference of 0.24%), European (7.6%, a difference of 0.27%), Immigrants from the Azores (7.5%, a difference of 0.28%), and Spaniard (7.6%, a difference of 0.53%).
| Demographics | Rating | Rank | 4 or more Vehicles in Household |
| English | 100.0 /100 | #56 | Exceptional 7.6% |
| Pennsylvania Germans | 100.0 /100 | #57 | Exceptional 7.6% |
| Swedes | 100.0 /100 | #58 | Exceptional 7.6% |
| Hispanics or Latinos | 100.0 /100 | #59 | Exceptional 7.6% |
| Spaniards | 100.0 /100 | #60 | Exceptional 7.6% |
| Europeans | 100.0 /100 | #61 | Exceptional 7.6% |
| Chippewa | 100.0 /100 | #62 | Exceptional 7.6% |
| Immigrants | Micronesia | 100.0 /100 | #63 | Exceptional 7.6% |
| Bangladeshis | 100.0 /100 | #64 | Exceptional 7.6% |
| Immigrants | Azores | 100.0 /100 | #65 | Exceptional 7.5% |
| Immigrants | Taiwan | 99.9 /100 | #66 | Exceptional 7.5% |
| Americans | 99.9 /100 | #67 | Exceptional 7.5% |
| Welsh | 99.9 /100 | #68 | Exceptional 7.5% |
| Germans | 99.9 /100 | #69 | Exceptional 7.5% |
| Scottish | 99.9 /100 | #70 | Exceptional 7.4% |
Demographics Similar to Asians by 4 or more Vehicles in Household
In terms of 4 or more vehicles in household, the demographic groups most similar to Asians are Blackfeet (7.0%, a difference of 0.010%), Pakistani (7.0%, a difference of 0.070%), Taiwanese (7.0%, a difference of 0.14%), Seminole (7.0%, a difference of 0.21%), and Hmong (7.0%, a difference of 0.49%).
| Demographics | Rating | Rank | 4 or more Vehicles in Household |
| Czechoslovakians | 99.3 /100 | #95 | Exceptional 7.1% |
| Central Americans | 99.3 /100 | #96 | Exceptional 7.1% |
| Celtics | 99.1 /100 | #97 | Exceptional 7.1% |
| Irish | 99.0 /100 | #98 | Exceptional 7.1% |
| Seminole | 98.8 /100 | #99 | Exceptional 7.0% |
| Taiwanese | 98.7 /100 | #100 | Exceptional 7.0% |
| Pakistanis | 98.7 /100 | #101 | Exceptional 7.0% |
| Asians | 98.6 /100 | #102 | Exceptional 7.0% |
| Blackfeet | 98.6 /100 | #103 | Exceptional 7.0% |
| Hmong | 98.3 /100 | #104 | Exceptional 7.0% |
| German Russians | 98.3 /100 | #105 | Exceptional 7.0% |
| Guatemalans | 98.1 /100 | #106 | Exceptional 7.0% |
| Nicaraguans | 98.0 /100 | #107 | Exceptional 7.0% |
| French | 97.7 /100 | #108 | Exceptional 6.9% |
| Filipinos | 97.6 /100 | #109 | Exceptional 6.9% |