Immigrants from Micronesia vs Immigrants from Eastern Europe 4 or more Vehicles in Household
COMPARE
Immigrants from Micronesia
Immigrants from Eastern Europe
4 or more Vehicles in Household
4 or more Vehicles in Household Comparison
Immigrants from Micronesia
Immigrants from Eastern Europe
7.6%
4 OR MORE VEHICLES IN HOUSEHOLD
100.0/ 100
METRIC RATING
63rd/ 347
METRIC RANK
5.4%
4 OR MORE VEHICLES IN HOUSEHOLD
0.4/ 100
METRIC RATING
278th/ 347
METRIC RANK
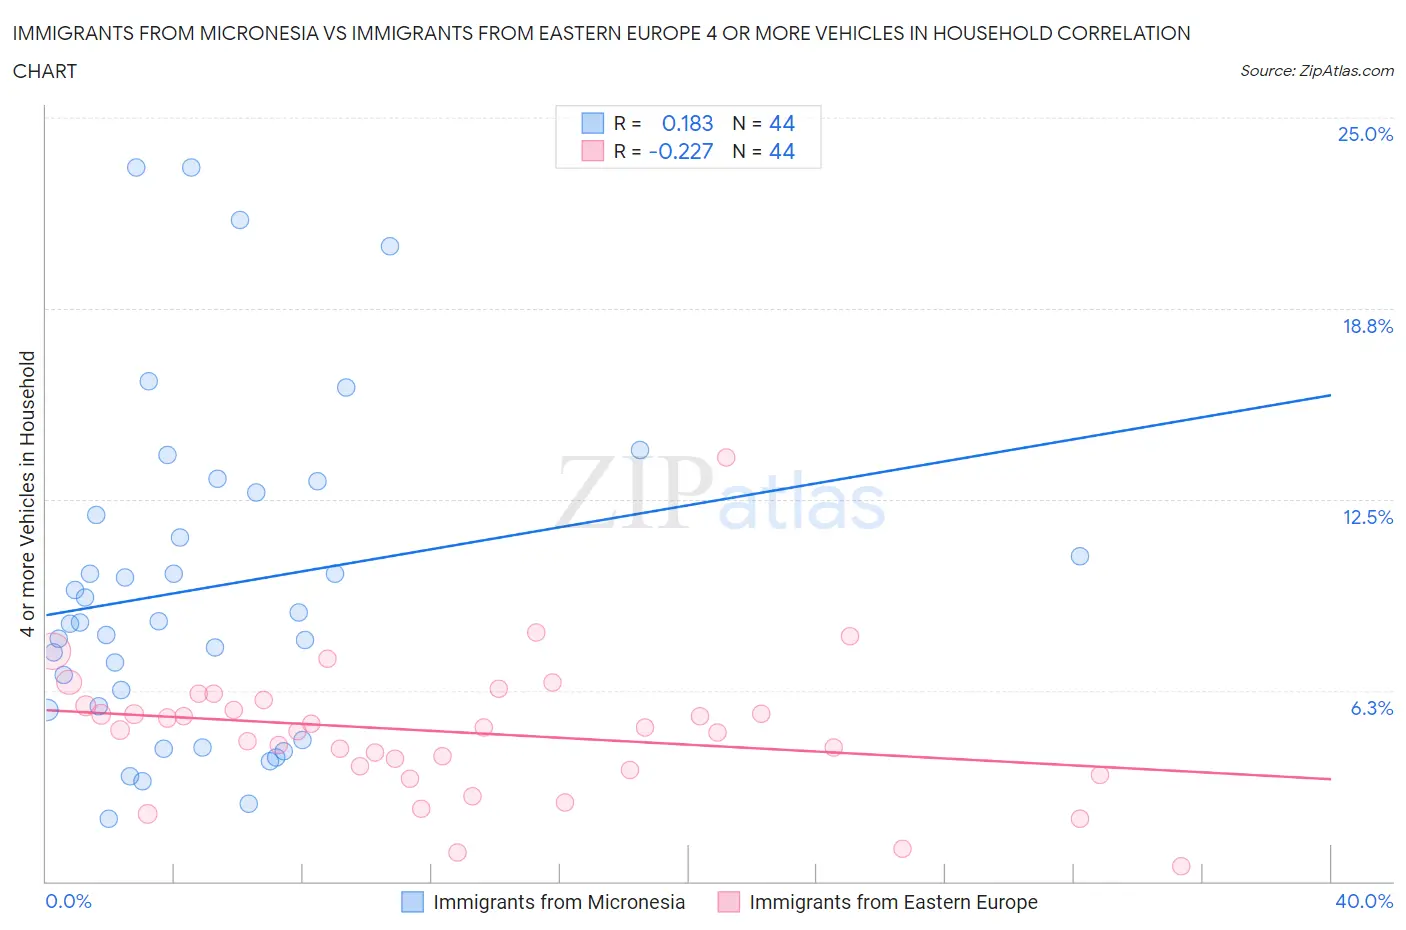
Immigrants from Micronesia vs Immigrants from Eastern Europe 4 or more Vehicles in Household Correlation Chart
The statistical analysis conducted on geographies consisting of 61,547,693 people shows a poor positive correlation between the proportion of Immigrants from Micronesia and percentage of households with 4 or more vehicles available in the United States with a correlation coefficient (R) of 0.183 and weighted average of 7.6%. Similarly, the statistical analysis conducted on geographies consisting of 473,333,841 people shows a weak negative correlation between the proportion of Immigrants from Eastern Europe and percentage of households with 4 or more vehicles available in the United States with a correlation coefficient (R) of -0.227 and weighted average of 5.4%, a difference of 39.3%.
4 or more Vehicles in Household Correlation Summary
| Measurement | Immigrants from Micronesia | Immigrants from Eastern Europe |
| Minimum | 2.1% | 0.50% |
| Maximum | 23.4% | 13.9% |
| Range | 21.3% | 13.4% |
| Mean | 9.6% | 4.9% |
| Median | 8.5% | 5.0% |
| Interquartile 25% (IQ1) | 5.7% | 3.7% |
| Interquartile 75% (IQ3) | 12.4% | 5.8% |
| Interquartile Range (IQR) | 6.7% | 2.1% |
| Standard Deviation (Sample) | 5.4% | 2.3% |
| Standard Deviation (Population) | 5.3% | 2.2% |
Similar Demographics by 4 or more Vehicles in Household
Demographics Similar to Immigrants from Micronesia by 4 or more Vehicles in Household
In terms of 4 or more vehicles in household, the demographic groups most similar to Immigrants from Micronesia are Chippewa (7.6%, a difference of 0.010%), Bangladeshi (7.6%, a difference of 0.24%), European (7.6%, a difference of 0.27%), Immigrants from the Azores (7.5%, a difference of 0.28%), and Spaniard (7.6%, a difference of 0.53%).
| Demographics | Rating | Rank | 4 or more Vehicles in Household |
| English | 100.0 /100 | #56 | Exceptional 7.6% |
| Pennsylvania Germans | 100.0 /100 | #57 | Exceptional 7.6% |
| Swedes | 100.0 /100 | #58 | Exceptional 7.6% |
| Hispanics or Latinos | 100.0 /100 | #59 | Exceptional 7.6% |
| Spaniards | 100.0 /100 | #60 | Exceptional 7.6% |
| Europeans | 100.0 /100 | #61 | Exceptional 7.6% |
| Chippewa | 100.0 /100 | #62 | Exceptional 7.6% |
| Immigrants | Micronesia | 100.0 /100 | #63 | Exceptional 7.6% |
| Bangladeshis | 100.0 /100 | #64 | Exceptional 7.6% |
| Immigrants | Azores | 100.0 /100 | #65 | Exceptional 7.5% |
| Immigrants | Taiwan | 99.9 /100 | #66 | Exceptional 7.5% |
| Americans | 99.9 /100 | #67 | Exceptional 7.5% |
| Welsh | 99.9 /100 | #68 | Exceptional 7.5% |
| Germans | 99.9 /100 | #69 | Exceptional 7.5% |
| Scottish | 99.9 /100 | #70 | Exceptional 7.4% |
Demographics Similar to Immigrants from Eastern Europe by 4 or more Vehicles in Household
In terms of 4 or more vehicles in household, the demographic groups most similar to Immigrants from Eastern Europe are Immigrants from Uruguay (5.4%, a difference of 0.46%), Alsatian (5.4%, a difference of 0.47%), Immigrants from Western Africa (5.4%, a difference of 0.54%), Immigrants from Spain (5.4%, a difference of 0.71%), and Immigrants from Ireland (5.4%, a difference of 0.79%).
| Demographics | Rating | Rank | 4 or more Vehicles in Household |
| Immigrants | Sudan | 0.6 /100 | #271 | Tragic 5.5% |
| Immigrants | Kazakhstan | 0.6 /100 | #272 | Tragic 5.5% |
| Macedonians | 0.6 /100 | #273 | Tragic 5.5% |
| Blacks/African Americans | 0.6 /100 | #274 | Tragic 5.5% |
| Cambodians | 0.5 /100 | #275 | Tragic 5.5% |
| Immigrants | Latvia | 0.5 /100 | #276 | Tragic 5.5% |
| Immigrants | Bulgaria | 0.5 /100 | #277 | Tragic 5.5% |
| Immigrants | Eastern Europe | 0.4 /100 | #278 | Tragic 5.4% |
| Immigrants | Uruguay | 0.3 /100 | #279 | Tragic 5.4% |
| Alsatians | 0.3 /100 | #280 | Tragic 5.4% |
| Immigrants | Western Africa | 0.3 /100 | #281 | Tragic 5.4% |
| Immigrants | Spain | 0.3 /100 | #282 | Tragic 5.4% |
| Immigrants | Ireland | 0.3 /100 | #283 | Tragic 5.4% |
| Brazilians | 0.3 /100 | #284 | Tragic 5.4% |
| Immigrants | Liberia | 0.2 /100 | #285 | Tragic 5.4% |