Immigrants from Ireland vs Alaska Native 4 or more Vehicles in Household
COMPARE
Immigrants from Ireland
Alaska Native
4 or more Vehicles in Household
4 or more Vehicles in Household Comparison
Immigrants from Ireland
Alaska Natives
5.4%
4 OR MORE VEHICLES IN HOUSEHOLD
0.3/ 100
METRIC RATING
283rd/ 347
METRIC RANK
7.3%
4 OR MORE VEHICLES IN HOUSEHOLD
99.8/ 100
METRIC RATING
80th/ 347
METRIC RANK
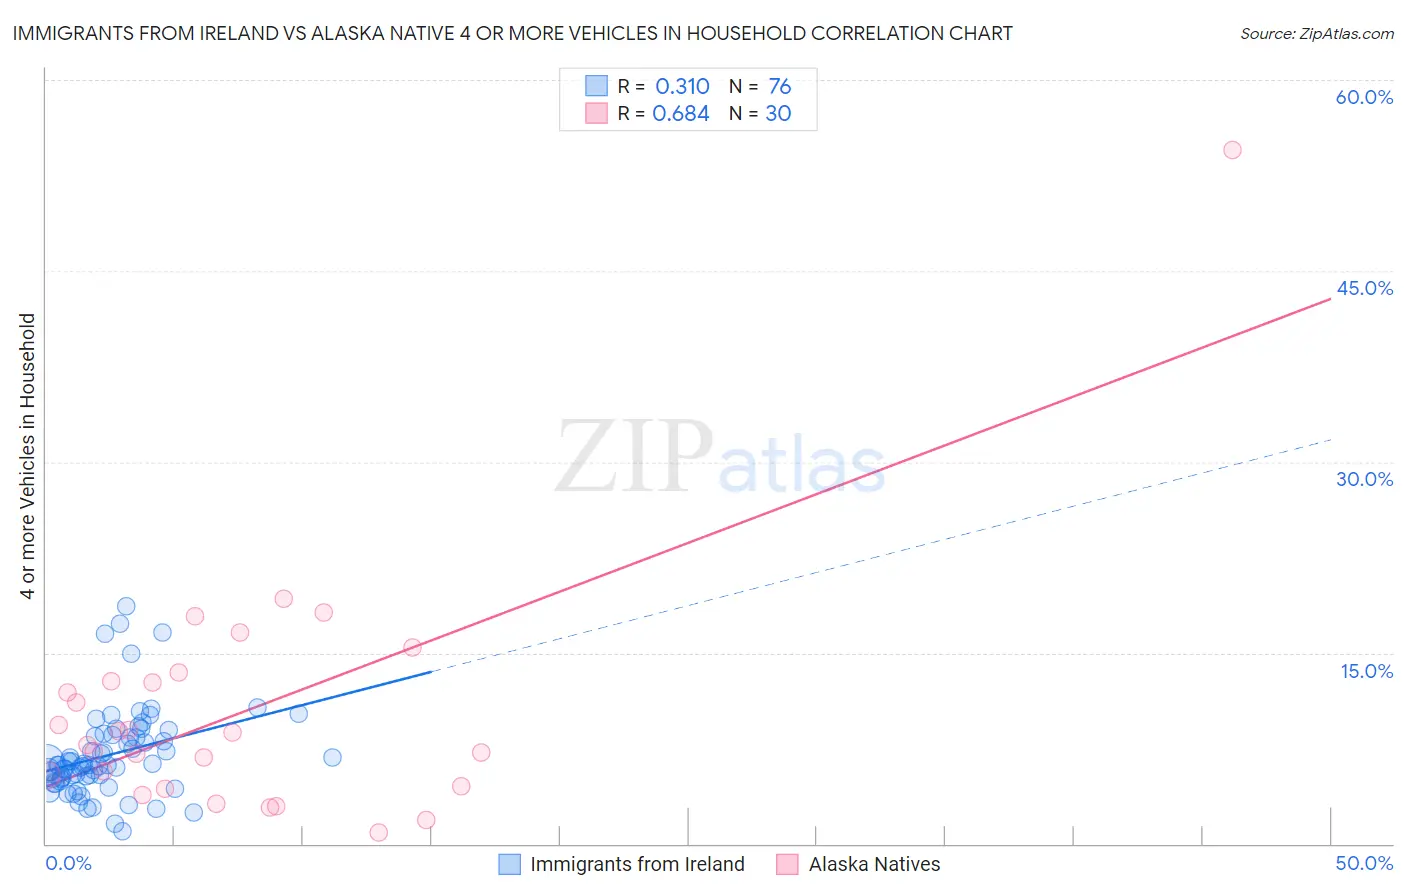
Immigrants from Ireland vs Alaska Native 4 or more Vehicles in Household Correlation Chart
The statistical analysis conducted on geographies consisting of 239,720,529 people shows a mild positive correlation between the proportion of Immigrants from Ireland and percentage of households with 4 or more vehicles available in the United States with a correlation coefficient (R) of 0.310 and weighted average of 5.4%. Similarly, the statistical analysis conducted on geographies consisting of 76,511,900 people shows a significant positive correlation between the proportion of Alaska Natives and percentage of households with 4 or more vehicles available in the United States with a correlation coefficient (R) of 0.684 and weighted average of 7.3%, a difference of 36.2%.
4 or more Vehicles in Household Correlation Summary
| Measurement | Immigrants from Ireland | Alaska Native |
| Minimum | 0.96% | 0.90% |
| Maximum | 18.7% | 54.5% |
| Range | 17.7% | 53.6% |
| Mean | 7.0% | 10.4% |
| Median | 6.2% | 8.3% |
| Interquartile 25% (IQ1) | 5.1% | 4.5% |
| Interquartile 75% (IQ3) | 8.5% | 12.7% |
| Interquartile Range (IQR) | 3.3% | 8.2% |
| Standard Deviation (Sample) | 3.4% | 9.8% |
| Standard Deviation (Population) | 3.4% | 9.6% |
Similar Demographics by 4 or more Vehicles in Household
Demographics Similar to Immigrants from Ireland by 4 or more Vehicles in Household
In terms of 4 or more vehicles in household, the demographic groups most similar to Immigrants from Ireland are Immigrants from Spain (5.4%, a difference of 0.080%), Immigrants from Western Africa (5.4%, a difference of 0.25%), Brazilian (5.4%, a difference of 0.29%), Alsatian (5.4%, a difference of 0.32%), and Immigrants from Uruguay (5.4%, a difference of 0.33%).
| Demographics | Rating | Rank | 4 or more Vehicles in Household |
| Immigrants | Latvia | 0.5 /100 | #276 | Tragic 5.5% |
| Immigrants | Bulgaria | 0.5 /100 | #277 | Tragic 5.5% |
| Immigrants | Eastern Europe | 0.4 /100 | #278 | Tragic 5.4% |
| Immigrants | Uruguay | 0.3 /100 | #279 | Tragic 5.4% |
| Alsatians | 0.3 /100 | #280 | Tragic 5.4% |
| Immigrants | Western Africa | 0.3 /100 | #281 | Tragic 5.4% |
| Immigrants | Spain | 0.3 /100 | #282 | Tragic 5.4% |
| Immigrants | Ireland | 0.3 /100 | #283 | Tragic 5.4% |
| Brazilians | 0.3 /100 | #284 | Tragic 5.4% |
| Immigrants | Liberia | 0.2 /100 | #285 | Tragic 5.4% |
| Immigrants | Colombia | 0.2 /100 | #286 | Tragic 5.4% |
| Immigrants | Croatia | 0.2 /100 | #287 | Tragic 5.4% |
| Venezuelans | 0.2 /100 | #288 | Tragic 5.3% |
| Immigrants | Bosnia and Herzegovina | 0.2 /100 | #289 | Tragic 5.3% |
| Immigrants | Russia | 0.2 /100 | #290 | Tragic 5.3% |
Demographics Similar to Alaska Natives by 4 or more Vehicles in Household
In terms of 4 or more vehicles in household, the demographic groups most similar to Alaska Natives are Czech (7.4%, a difference of 0.14%), White/Caucasian (7.4%, a difference of 0.31%), Apache (7.4%, a difference of 0.38%), Laotian (7.4%, a difference of 0.54%), and Finnish (7.3%, a difference of 0.56%).
| Demographics | Rating | Rank | 4 or more Vehicles in Household |
| Portuguese | 99.9 /100 | #73 | Exceptional 7.4% |
| Icelanders | 99.9 /100 | #74 | Exceptional 7.4% |
| Immigrants | Cambodia | 99.9 /100 | #75 | Exceptional 7.4% |
| Laotians | 99.9 /100 | #76 | Exceptional 7.4% |
| Apache | 99.9 /100 | #77 | Exceptional 7.4% |
| Whites/Caucasians | 99.8 /100 | #78 | Exceptional 7.4% |
| Czechs | 99.8 /100 | #79 | Exceptional 7.4% |
| Alaska Natives | 99.8 /100 | #80 | Exceptional 7.3% |
| Finns | 99.8 /100 | #81 | Exceptional 7.3% |
| Northern Europeans | 99.8 /100 | #82 | Exceptional 7.3% |
| Potawatomi | 99.7 /100 | #83 | Exceptional 7.3% |
| Afghans | 99.7 /100 | #84 | Exceptional 7.3% |
| Cree | 99.7 /100 | #85 | Exceptional 7.2% |
| Immigrants | Indonesia | 99.6 /100 | #86 | Exceptional 7.2% |
| Delaware | 99.6 /100 | #87 | Exceptional 7.2% |