Immigrants from Burma/Myanmar vs Immigrants from Turkey 4 or more Vehicles in Household
COMPARE
Immigrants from Burma/Myanmar
Immigrants from Turkey
4 or more Vehicles in Household
4 or more Vehicles in Household Comparison
Immigrants from Burma/Myanmar
Immigrants from Turkey
6.2%
4 OR MORE VEHICLES IN HOUSEHOLD
37.5/ 100
METRIC RATING
183rd/ 347
METRIC RANK
5.7%
4 OR MORE VEHICLES IN HOUSEHOLD
1.5/ 100
METRIC RATING
256th/ 347
METRIC RANK
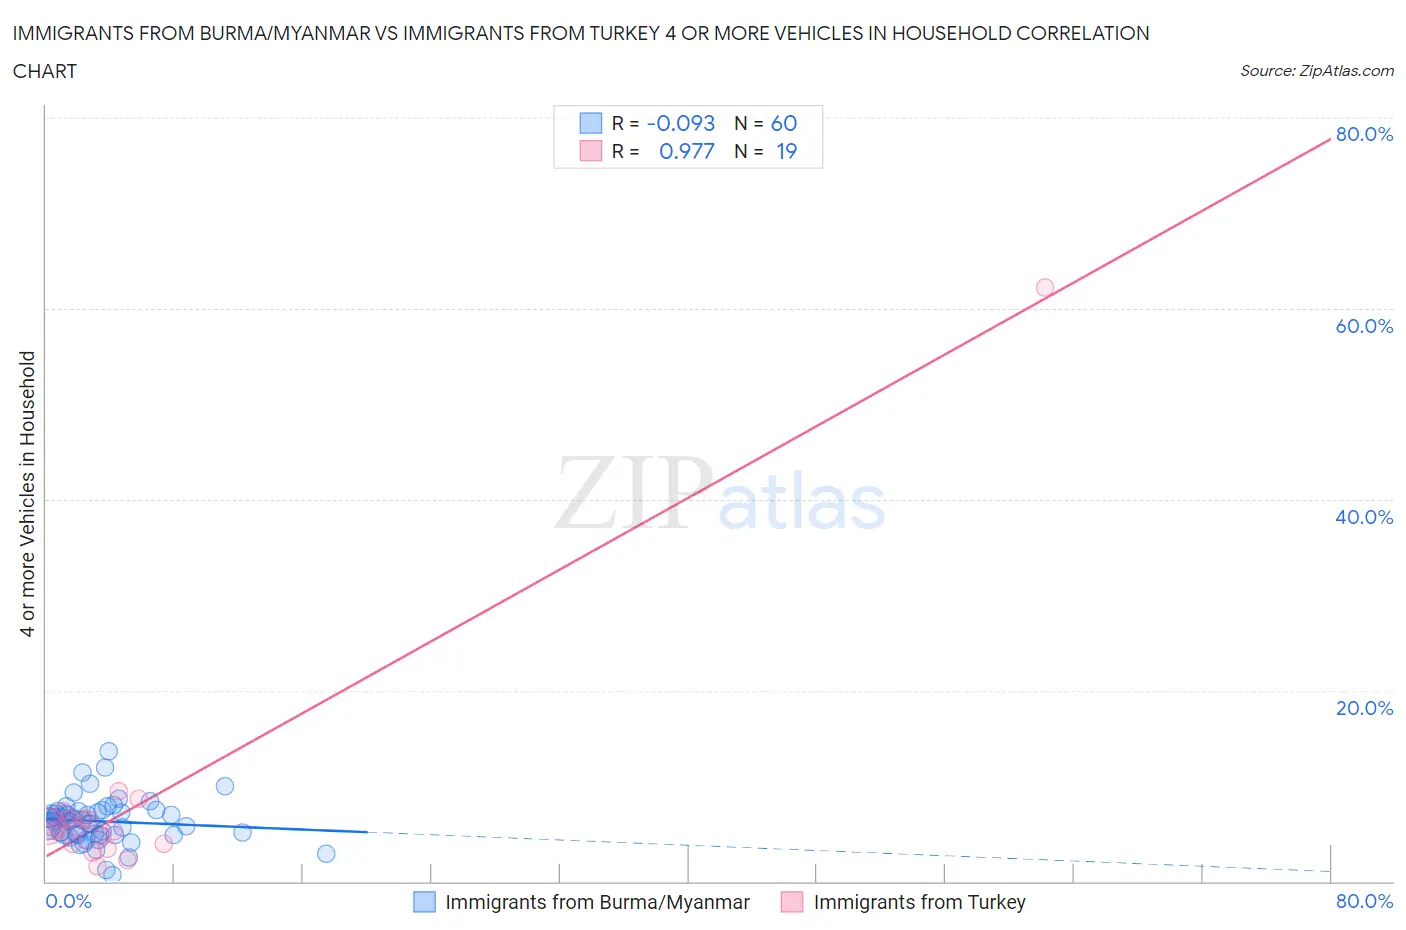
Immigrants from Burma/Myanmar vs Immigrants from Turkey 4 or more Vehicles in Household Correlation Chart
The statistical analysis conducted on geographies consisting of 171,874,303 people shows a slight negative correlation between the proportion of Immigrants from Burma/Myanmar and percentage of households with 4 or more vehicles available in the United States with a correlation coefficient (R) of -0.093 and weighted average of 6.2%. Similarly, the statistical analysis conducted on geographies consisting of 222,044,575 people shows a perfect positive correlation between the proportion of Immigrants from Turkey and percentage of households with 4 or more vehicles available in the United States with a correlation coefficient (R) of 0.977 and weighted average of 5.7%, a difference of 10.5%.
4 or more Vehicles in Household Correlation Summary
| Measurement | Immigrants from Burma/Myanmar | Immigrants from Turkey |
| Minimum | 0.59% | 1.5% |
| Maximum | 13.7% | 62.2% |
| Range | 13.1% | 60.6% |
| Mean | 6.3% | 8.3% |
| Median | 6.3% | 5.5% |
| Interquartile 25% (IQ1) | 4.9% | 3.9% |
| Interquartile 75% (IQ3) | 7.3% | 6.6% |
| Interquartile Range (IQR) | 2.4% | 2.6% |
| Standard Deviation (Sample) | 2.3% | 13.2% |
| Standard Deviation (Population) | 2.3% | 12.9% |
Similar Demographics by 4 or more Vehicles in Household
Demographics Similar to Immigrants from Burma/Myanmar by 4 or more Vehicles in Household
In terms of 4 or more vehicles in household, the demographic groups most similar to Immigrants from Burma/Myanmar are Iraqi (6.2%, a difference of 0.020%), Thai (6.2%, a difference of 0.060%), Immigrants from Northern Europe (6.2%, a difference of 0.080%), Immigrants from South Africa (6.2%, a difference of 0.23%), and Kiowa (6.2%, a difference of 0.31%).
| Demographics | Rating | Rank | 4 or more Vehicles in Household |
| Ukrainians | 47.6 /100 | #176 | Average 6.3% |
| Slovaks | 46.9 /100 | #177 | Average 6.3% |
| Belizeans | 44.5 /100 | #178 | Average 6.3% |
| Immigrants | Japan | 43.1 /100 | #179 | Average 6.3% |
| Syrians | 42.0 /100 | #180 | Average 6.3% |
| Yugoslavians | 41.1 /100 | #181 | Average 6.3% |
| South American Indians | 40.7 /100 | #182 | Average 6.3% |
| Immigrants | Burma/Myanmar | 37.5 /100 | #183 | Fair 6.2% |
| Iraqis | 37.3 /100 | #184 | Fair 6.2% |
| Thais | 36.9 /100 | #185 | Fair 6.2% |
| Immigrants | Northern Europe | 36.8 /100 | #186 | Fair 6.2% |
| Immigrants | South Africa | 35.4 /100 | #187 | Fair 6.2% |
| Kiowa | 34.7 /100 | #188 | Fair 6.2% |
| Immigrants | Eastern Asia | 33.3 /100 | #189 | Fair 6.2% |
| South Africans | 32.2 /100 | #190 | Fair 6.2% |
Demographics Similar to Immigrants from Turkey by 4 or more Vehicles in Household
In terms of 4 or more vehicles in household, the demographic groups most similar to Immigrants from Turkey are Yup'ik (5.7%, a difference of 0.040%), Immigrants from Northern Africa (5.6%, a difference of 0.080%), Immigrants from Panama (5.7%, a difference of 0.12%), Immigrants from Lithuania (5.6%, a difference of 0.22%), and Immigrants from France (5.6%, a difference of 0.25%).
| Demographics | Rating | Rank | 4 or more Vehicles in Household |
| Immigrants | Southern Europe | 2.3 /100 | #249 | Tragic 5.7% |
| Immigrants | Europe | 2.3 /100 | #250 | Tragic 5.7% |
| Ugandans | 2.2 /100 | #251 | Tragic 5.7% |
| Sub-Saharan Africans | 2.1 /100 | #252 | Tragic 5.7% |
| Immigrants | Cuba | 1.6 /100 | #253 | Tragic 5.7% |
| Immigrants | Panama | 1.5 /100 | #254 | Tragic 5.7% |
| Yup'ik | 1.5 /100 | #255 | Tragic 5.7% |
| Immigrants | Turkey | 1.5 /100 | #256 | Tragic 5.7% |
| Immigrants | Northern Africa | 1.4 /100 | #257 | Tragic 5.6% |
| Immigrants | Lithuania | 1.4 /100 | #258 | Tragic 5.6% |
| Immigrants | France | 1.3 /100 | #259 | Tragic 5.6% |
| Uruguayans | 1.3 /100 | #260 | Tragic 5.6% |
| Sudanese | 1.2 /100 | #261 | Tragic 5.6% |
| Bermudans | 1.2 /100 | #262 | Tragic 5.6% |
| Immigrants | Saudi Arabia | 1.1 /100 | #263 | Tragic 5.6% |