Immigrants from Burma/Myanmar vs Yuman 4 or more Vehicles in Household
COMPARE
Immigrants from Burma/Myanmar
Yuman
4 or more Vehicles in Household
4 or more Vehicles in Household Comparison
Immigrants from Burma/Myanmar
Yuman
6.2%
4 OR MORE VEHICLES IN HOUSEHOLD
37.5/ 100
METRIC RATING
183rd/ 347
METRIC RANK
6.5%
4 OR MORE VEHICLES IN HOUSEHOLD
72.1/ 100
METRIC RATING
152nd/ 347
METRIC RANK
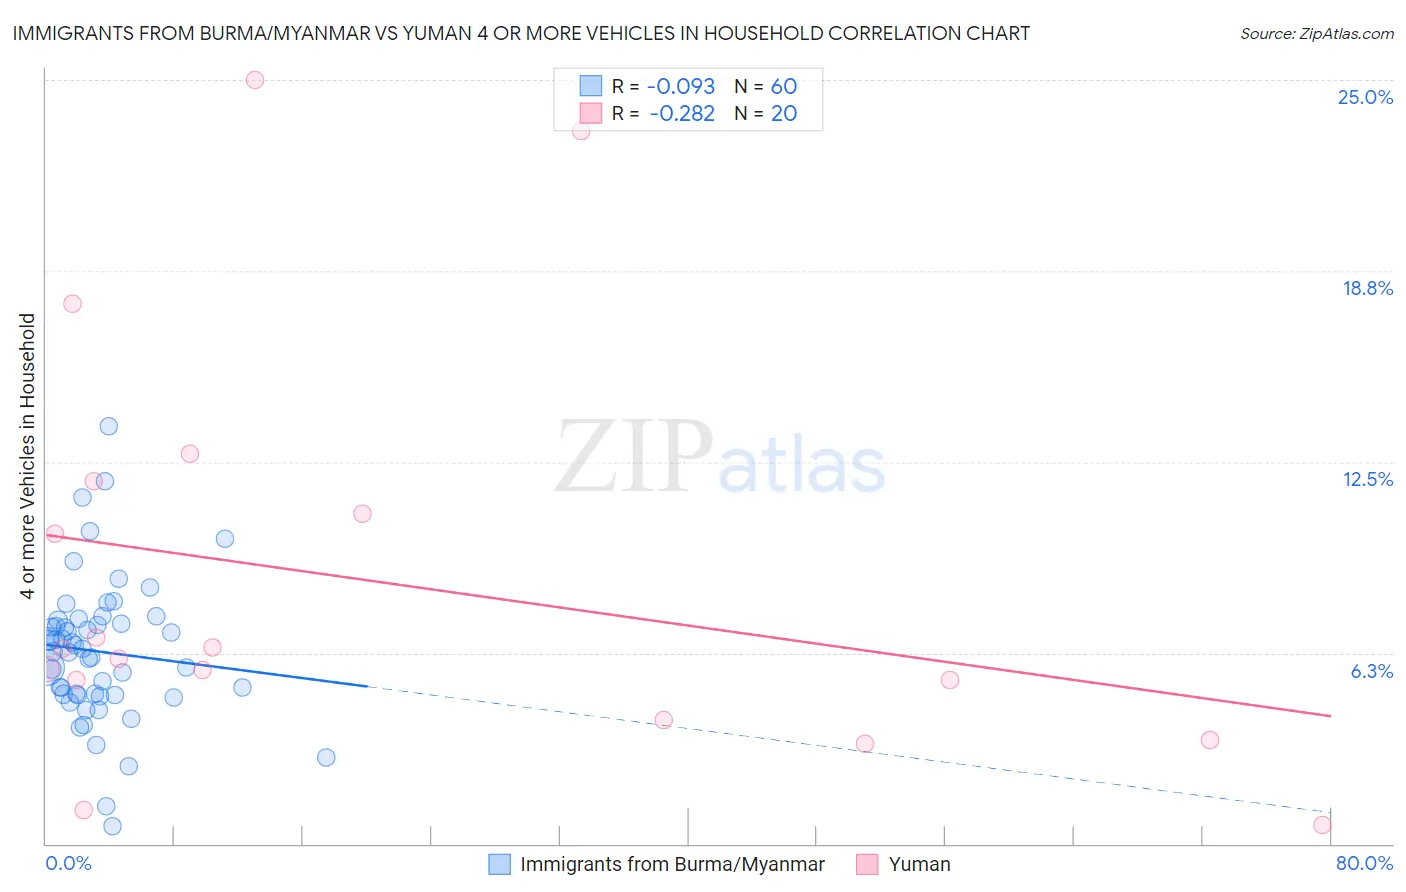
Immigrants from Burma/Myanmar vs Yuman 4 or more Vehicles in Household Correlation Chart
The statistical analysis conducted on geographies consisting of 171,874,303 people shows a slight negative correlation between the proportion of Immigrants from Burma/Myanmar and percentage of households with 4 or more vehicles available in the United States with a correlation coefficient (R) of -0.093 and weighted average of 6.2%. Similarly, the statistical analysis conducted on geographies consisting of 40,628,195 people shows a weak negative correlation between the proportion of Yuman and percentage of households with 4 or more vehicles available in the United States with a correlation coefficient (R) of -0.282 and weighted average of 6.5%, a difference of 3.7%.
4 or more Vehicles in Household Correlation Summary
| Measurement | Immigrants from Burma/Myanmar | Yuman |
| Minimum | 0.59% | 0.62% |
| Maximum | 13.7% | 25.0% |
| Range | 13.1% | 24.4% |
| Mean | 6.3% | 8.6% |
| Median | 6.3% | 6.2% |
| Interquartile 25% (IQ1) | 4.9% | 4.7% |
| Interquartile 75% (IQ3) | 7.3% | 11.3% |
| Interquartile Range (IQR) | 2.4% | 6.6% |
| Standard Deviation (Sample) | 2.3% | 6.7% |
| Standard Deviation (Population) | 2.3% | 6.5% |
Similar Demographics by 4 or more Vehicles in Household
Demographics Similar to Immigrants from Burma/Myanmar by 4 or more Vehicles in Household
In terms of 4 or more vehicles in household, the demographic groups most similar to Immigrants from Burma/Myanmar are Iraqi (6.2%, a difference of 0.020%), Thai (6.2%, a difference of 0.060%), Immigrants from Northern Europe (6.2%, a difference of 0.080%), Immigrants from South Africa (6.2%, a difference of 0.23%), and Kiowa (6.2%, a difference of 0.31%).
| Demographics | Rating | Rank | 4 or more Vehicles in Household |
| Ukrainians | 47.6 /100 | #176 | Average 6.3% |
| Slovaks | 46.9 /100 | #177 | Average 6.3% |
| Belizeans | 44.5 /100 | #178 | Average 6.3% |
| Immigrants | Japan | 43.1 /100 | #179 | Average 6.3% |
| Syrians | 42.0 /100 | #180 | Average 6.3% |
| Yugoslavians | 41.1 /100 | #181 | Average 6.3% |
| South American Indians | 40.7 /100 | #182 | Average 6.3% |
| Immigrants | Burma/Myanmar | 37.5 /100 | #183 | Fair 6.2% |
| Iraqis | 37.3 /100 | #184 | Fair 6.2% |
| Thais | 36.9 /100 | #185 | Fair 6.2% |
| Immigrants | Northern Europe | 36.8 /100 | #186 | Fair 6.2% |
| Immigrants | South Africa | 35.4 /100 | #187 | Fair 6.2% |
| Kiowa | 34.7 /100 | #188 | Fair 6.2% |
| Immigrants | Eastern Asia | 33.3 /100 | #189 | Fair 6.2% |
| South Africans | 32.2 /100 | #190 | Fair 6.2% |
Demographics Similar to Yuman by 4 or more Vehicles in Household
In terms of 4 or more vehicles in household, the demographic groups most similar to Yuman are Immigrants from Hong Kong (6.5%, a difference of 0.010%), Immigrants from Armenia (6.5%, a difference of 0.11%), Central American Indian (6.5%, a difference of 0.13%), New Zealander (6.5%, a difference of 0.15%), and Immigrants from Jordan (6.5%, a difference of 0.19%).
| Demographics | Rating | Rank | 4 or more Vehicles in Household |
| Croatians | 77.8 /100 | #145 | Good 6.5% |
| Immigrants | Costa Rica | 74.4 /100 | #146 | Good 6.5% |
| Immigrants | Iran | 73.9 /100 | #147 | Good 6.5% |
| Immigrants | Jordan | 73.7 /100 | #148 | Good 6.5% |
| Greeks | 73.6 /100 | #149 | Good 6.5% |
| New Zealanders | 73.3 /100 | #150 | Good 6.5% |
| Immigrants | Hong Kong | 72.2 /100 | #151 | Good 6.5% |
| Yuman | 72.1 /100 | #152 | Good 6.5% |
| Immigrants | Armenia | 71.2 /100 | #153 | Good 6.5% |
| Central American Indians | 71.1 /100 | #154 | Good 6.5% |
| Iroquois | 70.4 /100 | #155 | Good 6.5% |
| Iranians | 69.9 /100 | #156 | Good 6.5% |
| Peruvians | 69.4 /100 | #157 | Good 6.5% |
| Zimbabweans | 67.1 /100 | #158 | Good 6.4% |
| Indians (Asian) | 66.3 /100 | #159 | Good 6.4% |