French American Indian vs Lumbee 4 or more Vehicles in Household
COMPARE
French American Indian
Lumbee
4 or more Vehicles in Household
4 or more Vehicles in Household Comparison
French American Indians
Lumbee
6.8%
4 OR MORE VEHICLES IN HOUSEHOLD
95.7/ 100
METRIC RATING
118th/ 347
METRIC RANK
8.8%
4 OR MORE VEHICLES IN HOUSEHOLD
100.0/ 100
METRIC RATING
16th/ 347
METRIC RANK
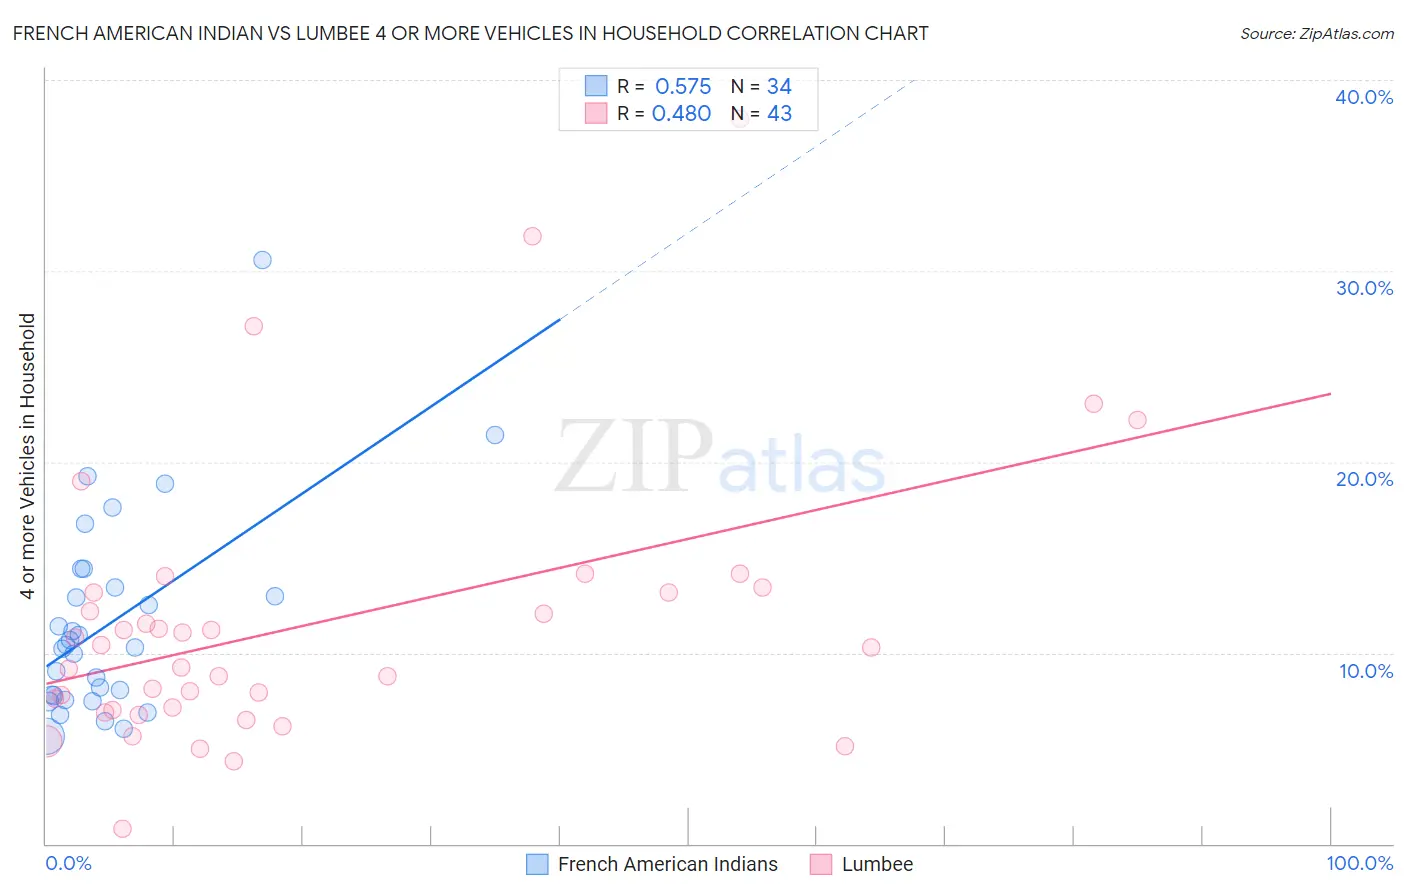
French American Indian vs Lumbee 4 or more Vehicles in Household Correlation Chart
The statistical analysis conducted on geographies consisting of 131,879,224 people shows a substantial positive correlation between the proportion of French American Indians and percentage of households with 4 or more vehicles available in the United States with a correlation coefficient (R) of 0.575 and weighted average of 6.8%. Similarly, the statistical analysis conducted on geographies consisting of 92,195,503 people shows a moderate positive correlation between the proportion of Lumbee and percentage of households with 4 or more vehicles available in the United States with a correlation coefficient (R) of 0.480 and weighted average of 8.8%, a difference of 28.7%.
4 or more Vehicles in Household Correlation Summary
| Measurement | French American Indian | Lumbee |
| Minimum | 5.6% | 0.79% |
| Maximum | 30.6% | 38.0% |
| Range | 25.0% | 37.2% |
| Mean | 11.6% | 11.6% |
| Median | 10.3% | 10.3% |
| Interquartile 25% (IQ1) | 7.8% | 7.0% |
| Interquartile 75% (IQ3) | 13.4% | 13.2% |
| Interquartile Range (IQR) | 5.6% | 6.2% |
| Standard Deviation (Sample) | 5.3% | 7.3% |
| Standard Deviation (Population) | 5.2% | 7.2% |
Similar Demographics by 4 or more Vehicles in Household
Demographics Similar to French American Indians by 4 or more Vehicles in Household
In terms of 4 or more vehicles in household, the demographic groups most similar to French American Indians are Burmese (6.8%, a difference of 0.0%), Immigrants from Guatemala (6.8%, a difference of 0.020%), Costa Rican (6.8%, a difference of 0.11%), Tlingit-Haida (6.8%, a difference of 0.28%), and Bolivian (6.8%, a difference of 0.34%).
| Demographics | Rating | Rank | 4 or more Vehicles in Household |
| Aleuts | 97.0 /100 | #111 | Exceptional 6.9% |
| Hopi | 97.0 /100 | #112 | Exceptional 6.9% |
| Canadians | 96.4 /100 | #113 | Exceptional 6.9% |
| Bolivians | 96.3 /100 | #114 | Exceptional 6.8% |
| Tlingit-Haida | 96.2 /100 | #115 | Exceptional 6.8% |
| Immigrants | Guatemala | 95.8 /100 | #116 | Exceptional 6.8% |
| Burmese | 95.7 /100 | #117 | Exceptional 6.8% |
| French American Indians | 95.7 /100 | #118 | Exceptional 6.8% |
| Costa Ricans | 95.5 /100 | #119 | Exceptional 6.8% |
| Comanche | 94.8 /100 | #120 | Exceptional 6.8% |
| Immigrants | Germany | 94.7 /100 | #121 | Exceptional 6.8% |
| Immigrants | Nicaragua | 94.7 /100 | #122 | Exceptional 6.8% |
| Immigrants | Immigrants | 94.6 /100 | #123 | Exceptional 6.8% |
| Immigrants | Asia | 94.4 /100 | #124 | Exceptional 6.8% |
| Austrians | 94.1 /100 | #125 | Exceptional 6.8% |
Demographics Similar to Lumbee by 4 or more Vehicles in Household
In terms of 4 or more vehicles in household, the demographic groups most similar to Lumbee are Ute (8.8%, a difference of 0.33%), Nepalese (8.7%, a difference of 0.43%), Shoshone (8.8%, a difference of 0.71%), Chinese (8.8%, a difference of 0.74%), and Korean (8.6%, a difference of 1.6%).
| Demographics | Rating | Rank | 4 or more Vehicles in Household |
| Samoans | 100.0 /100 | #9 | Exceptional 9.2% |
| Paiute | 100.0 /100 | #10 | Exceptional 9.0% |
| Immigrants | Mexico | 100.0 /100 | #11 | Exceptional 9.0% |
| Mexicans | 100.0 /100 | #12 | Exceptional 8.9% |
| Hawaiians | 100.0 /100 | #13 | Exceptional 8.9% |
| Chinese | 100.0 /100 | #14 | Exceptional 8.8% |
| Shoshone | 100.0 /100 | #15 | Exceptional 8.8% |
| Lumbee | 100.0 /100 | #16 | Exceptional 8.8% |
| Ute | 100.0 /100 | #17 | Exceptional 8.8% |
| Nepalese | 100.0 /100 | #18 | Exceptional 8.7% |
| Koreans | 100.0 /100 | #19 | Exceptional 8.6% |
| Pueblo | 100.0 /100 | #20 | Exceptional 8.6% |
| Danes | 100.0 /100 | #21 | Exceptional 8.6% |
| Immigrants | Vietnam | 100.0 /100 | #22 | Exceptional 8.6% |
| Immigrants | Philippines | 100.0 /100 | #23 | Exceptional 8.5% |