French American Indian vs Bermudan 4 or more Vehicles in Household
COMPARE
French American Indian
Bermudan
4 or more Vehicles in Household
4 or more Vehicles in Household Comparison
French American Indians
Bermudans
6.8%
4 OR MORE VEHICLES IN HOUSEHOLD
95.7/ 100
METRIC RATING
118th/ 347
METRIC RANK
5.6%
4 OR MORE VEHICLES IN HOUSEHOLD
1.2/ 100
METRIC RATING
262nd/ 347
METRIC RANK
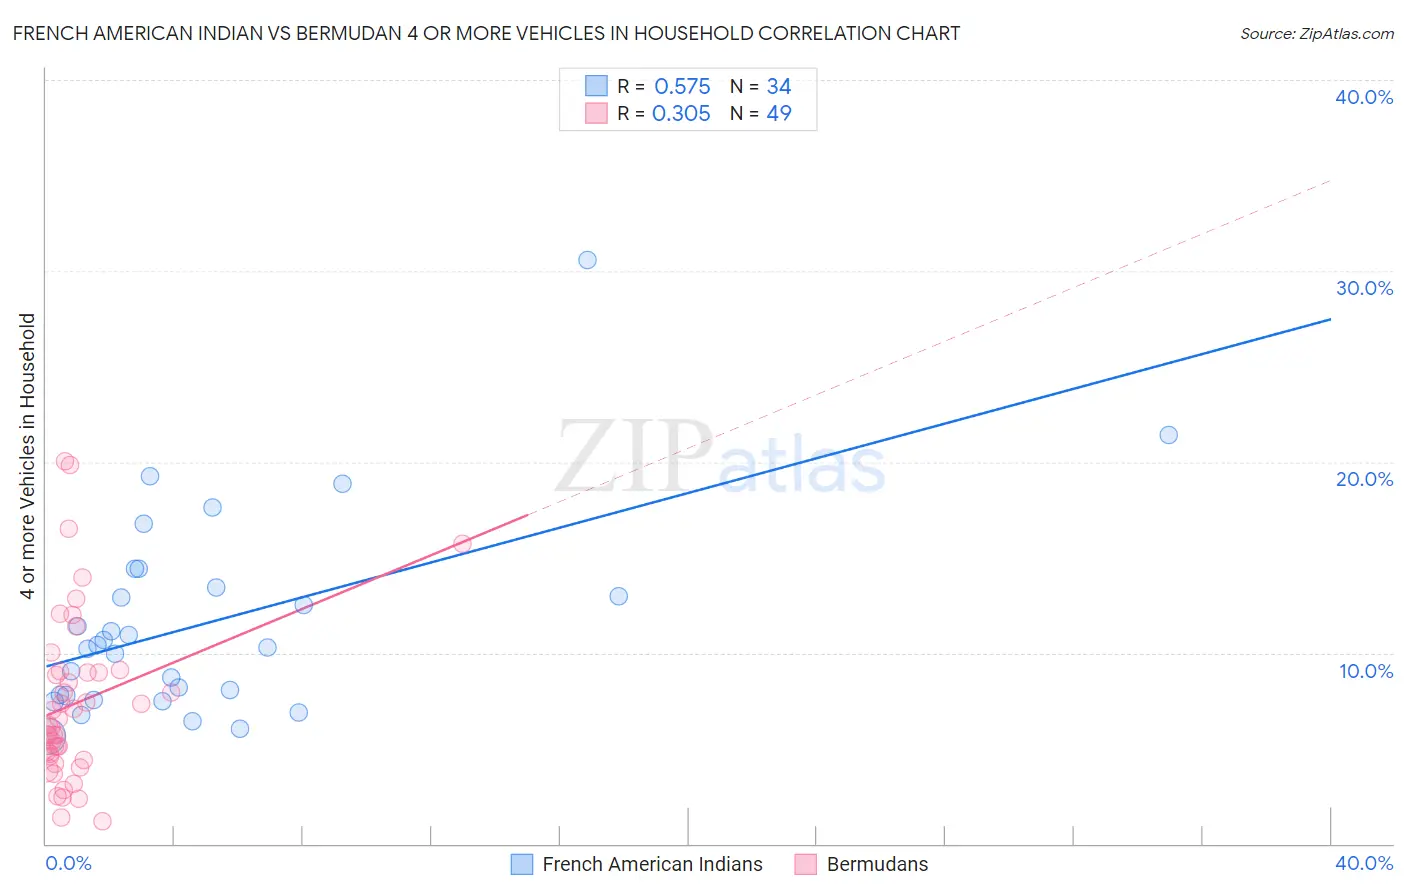
French American Indian vs Bermudan 4 or more Vehicles in Household Correlation Chart
The statistical analysis conducted on geographies consisting of 131,879,224 people shows a substantial positive correlation between the proportion of French American Indians and percentage of households with 4 or more vehicles available in the United States with a correlation coefficient (R) of 0.575 and weighted average of 6.8%. Similarly, the statistical analysis conducted on geographies consisting of 55,665,642 people shows a mild positive correlation between the proportion of Bermudans and percentage of households with 4 or more vehicles available in the United States with a correlation coefficient (R) of 0.305 and weighted average of 5.6%, a difference of 21.5%.
4 or more Vehicles in Household Correlation Summary
| Measurement | French American Indian | Bermudan |
| Minimum | 5.6% | 1.2% |
| Maximum | 30.6% | 20.0% |
| Range | 25.0% | 18.9% |
| Mean | 11.6% | 7.4% |
| Median | 10.3% | 6.2% |
| Interquartile 25% (IQ1) | 7.8% | 4.5% |
| Interquartile 75% (IQ3) | 13.4% | 9.0% |
| Interquartile Range (IQR) | 5.6% | 4.5% |
| Standard Deviation (Sample) | 5.3% | 4.4% |
| Standard Deviation (Population) | 5.2% | 4.3% |
Similar Demographics by 4 or more Vehicles in Household
Demographics Similar to French American Indians by 4 or more Vehicles in Household
In terms of 4 or more vehicles in household, the demographic groups most similar to French American Indians are Burmese (6.8%, a difference of 0.0%), Immigrants from Guatemala (6.8%, a difference of 0.020%), Costa Rican (6.8%, a difference of 0.11%), Tlingit-Haida (6.8%, a difference of 0.28%), and Bolivian (6.8%, a difference of 0.34%).
| Demographics | Rating | Rank | 4 or more Vehicles in Household |
| Aleuts | 97.0 /100 | #111 | Exceptional 6.9% |
| Hopi | 97.0 /100 | #112 | Exceptional 6.9% |
| Canadians | 96.4 /100 | #113 | Exceptional 6.9% |
| Bolivians | 96.3 /100 | #114 | Exceptional 6.8% |
| Tlingit-Haida | 96.2 /100 | #115 | Exceptional 6.8% |
| Immigrants | Guatemala | 95.8 /100 | #116 | Exceptional 6.8% |
| Burmese | 95.7 /100 | #117 | Exceptional 6.8% |
| French American Indians | 95.7 /100 | #118 | Exceptional 6.8% |
| Costa Ricans | 95.5 /100 | #119 | Exceptional 6.8% |
| Comanche | 94.8 /100 | #120 | Exceptional 6.8% |
| Immigrants | Germany | 94.7 /100 | #121 | Exceptional 6.8% |
| Immigrants | Nicaragua | 94.7 /100 | #122 | Exceptional 6.8% |
| Immigrants | Immigrants | 94.6 /100 | #123 | Exceptional 6.8% |
| Immigrants | Asia | 94.4 /100 | #124 | Exceptional 6.8% |
| Austrians | 94.1 /100 | #125 | Exceptional 6.8% |
Demographics Similar to Bermudans by 4 or more Vehicles in Household
In terms of 4 or more vehicles in household, the demographic groups most similar to Bermudans are Immigrants from Saudi Arabia (5.6%, a difference of 0.090%), Sudanese (5.6%, a difference of 0.11%), Uruguayan (5.6%, a difference of 0.20%), Immigrants from France (5.6%, a difference of 0.38%), and Immigrants from Lithuania (5.6%, a difference of 0.42%).
| Demographics | Rating | Rank | 4 or more Vehicles in Household |
| Yup'ik | 1.5 /100 | #255 | Tragic 5.7% |
| Immigrants | Turkey | 1.5 /100 | #256 | Tragic 5.7% |
| Immigrants | Northern Africa | 1.4 /100 | #257 | Tragic 5.6% |
| Immigrants | Lithuania | 1.4 /100 | #258 | Tragic 5.6% |
| Immigrants | France | 1.3 /100 | #259 | Tragic 5.6% |
| Uruguayans | 1.3 /100 | #260 | Tragic 5.6% |
| Sudanese | 1.2 /100 | #261 | Tragic 5.6% |
| Bermudans | 1.2 /100 | #262 | Tragic 5.6% |
| Immigrants | Saudi Arabia | 1.1 /100 | #263 | Tragic 5.6% |
| Immigrants | Africa | 1.0 /100 | #264 | Tragic 5.6% |
| South Americans | 0.9 /100 | #265 | Tragic 5.6% |
| Immigrants | Nepal | 0.9 /100 | #266 | Tragic 5.6% |
| Immigrants | Ukraine | 0.9 /100 | #267 | Tragic 5.6% |
| Colombians | 0.7 /100 | #268 | Tragic 5.5% |
| Carpatho Rusyns | 0.7 /100 | #269 | Tragic 5.5% |