Alaskan Athabascan vs Immigrants from France 4 or more Vehicles in Household
COMPARE
Alaskan Athabascan
Immigrants from France
4 or more Vehicles in Household
4 or more Vehicles in Household Comparison
Alaskan Athabascans
Immigrants from France
8.1%
4 OR MORE VEHICLES IN HOUSEHOLD
100.0/ 100
METRIC RATING
34th/ 347
METRIC RANK
5.6%
4 OR MORE VEHICLES IN HOUSEHOLD
1.3/ 100
METRIC RATING
259th/ 347
METRIC RANK
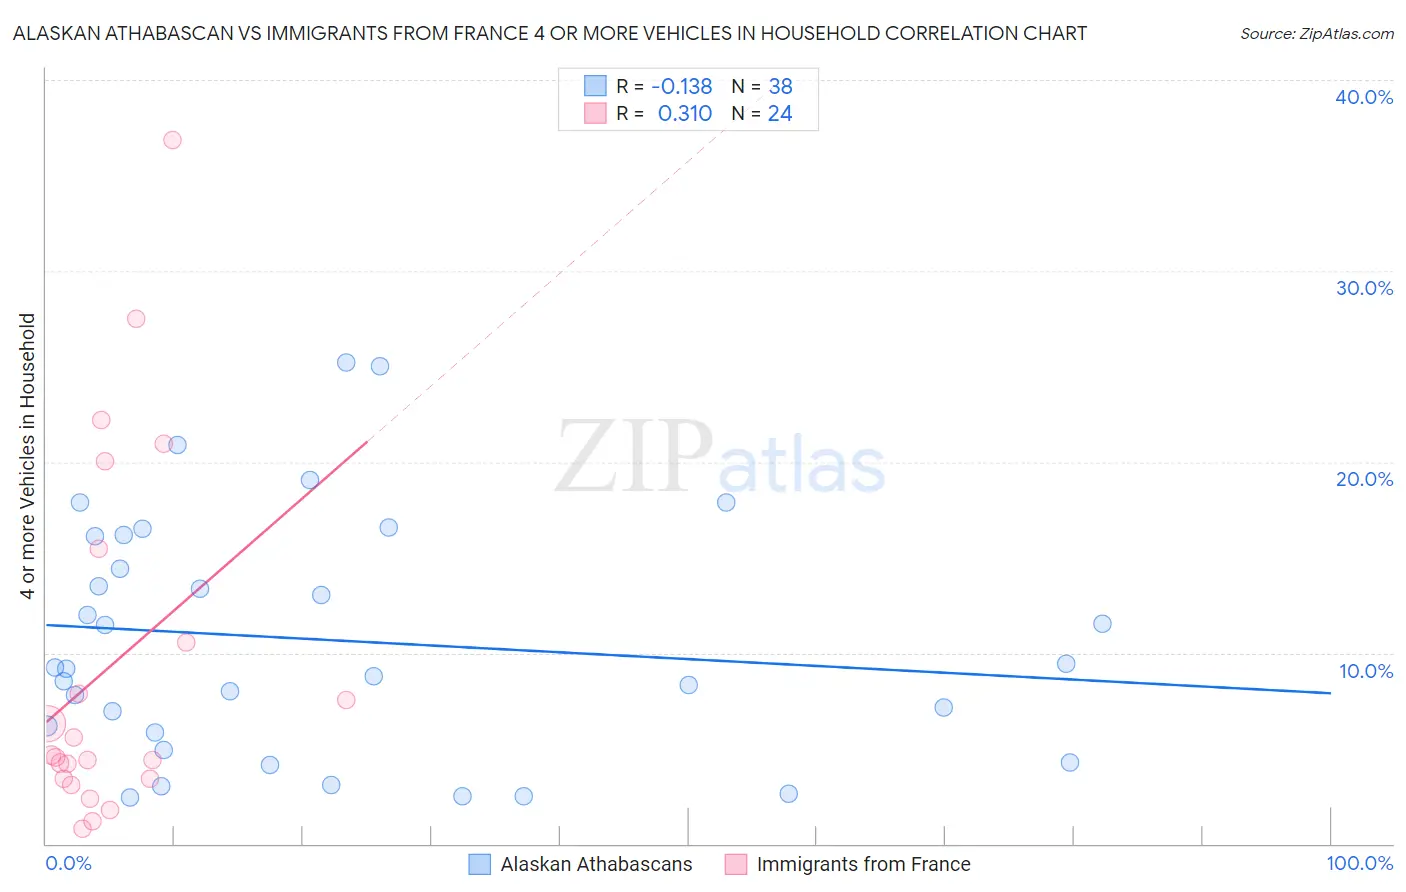
Alaskan Athabascan vs Immigrants from France 4 or more Vehicles in Household Correlation Chart
The statistical analysis conducted on geographies consisting of 45,776,205 people shows a poor negative correlation between the proportion of Alaskan Athabascans and percentage of households with 4 or more vehicles available in the United States with a correlation coefficient (R) of -0.138 and weighted average of 8.1%. Similarly, the statistical analysis conducted on geographies consisting of 286,406,976 people shows a mild positive correlation between the proportion of Immigrants from France and percentage of households with 4 or more vehicles available in the United States with a correlation coefficient (R) of 0.310 and weighted average of 5.6%, a difference of 43.2%.
4 or more Vehicles in Household Correlation Summary
| Measurement | Alaskan Athabascan | Immigrants from France |
| Minimum | 2.4% | 0.81% |
| Maximum | 25.2% | 36.8% |
| Range | 22.8% | 36.0% |
| Mean | 10.7% | 9.3% |
| Median | 9.2% | 4.6% |
| Interquartile 25% (IQ1) | 5.8% | 3.4% |
| Interquartile 75% (IQ3) | 16.1% | 13.0% |
| Interquartile Range (IQR) | 10.3% | 9.6% |
| Standard Deviation (Sample) | 6.3% | 9.5% |
| Standard Deviation (Population) | 6.2% | 9.3% |
Similar Demographics by 4 or more Vehicles in Household
Demographics Similar to Alaskan Athabascans by 4 or more Vehicles in Household
In terms of 4 or more vehicles in household, the demographic groups most similar to Alaskan Athabascans are Guamanian/Chamorro (8.1%, a difference of 0.20%), Yaqui (8.1%, a difference of 0.60%), Marshallese (8.1%, a difference of 0.89%), Norwegian (8.0%, a difference of 0.99%), and Scandinavian (8.0%, a difference of 1.2%).
| Demographics | Rating | Rank | 4 or more Vehicles in Household |
| Sri Lankans | 100.0 /100 | #27 | Exceptional 8.4% |
| Cheyenne | 100.0 /100 | #28 | Exceptional 8.3% |
| Immigrants | South Eastern Asia | 100.0 /100 | #29 | Exceptional 8.2% |
| Navajo | 100.0 /100 | #30 | Exceptional 8.2% |
| Natives/Alaskans | 100.0 /100 | #31 | Exceptional 8.2% |
| Marshallese | 100.0 /100 | #32 | Exceptional 8.1% |
| Yaqui | 100.0 /100 | #33 | Exceptional 8.1% |
| Alaskan Athabascans | 100.0 /100 | #34 | Exceptional 8.1% |
| Guamanians/Chamorros | 100.0 /100 | #35 | Exceptional 8.1% |
| Norwegians | 100.0 /100 | #36 | Exceptional 8.0% |
| Scandinavians | 100.0 /100 | #37 | Exceptional 8.0% |
| Sioux | 100.0 /100 | #38 | Exceptional 8.0% |
| Spanish Americans | 100.0 /100 | #39 | Exceptional 8.0% |
| Spanish | 100.0 /100 | #40 | Exceptional 7.9% |
| Pima | 100.0 /100 | #41 | Exceptional 7.9% |
Demographics Similar to Immigrants from France by 4 or more Vehicles in Household
In terms of 4 or more vehicles in household, the demographic groups most similar to Immigrants from France are Immigrants from Lithuania (5.6%, a difference of 0.030%), Immigrants from Northern Africa (5.6%, a difference of 0.17%), Uruguayan (5.6%, a difference of 0.18%), Immigrants from Turkey (5.7%, a difference of 0.25%), and Sudanese (5.6%, a difference of 0.27%).
| Demographics | Rating | Rank | 4 or more Vehicles in Household |
| Sub-Saharan Africans | 2.1 /100 | #252 | Tragic 5.7% |
| Immigrants | Cuba | 1.6 /100 | #253 | Tragic 5.7% |
| Immigrants | Panama | 1.5 /100 | #254 | Tragic 5.7% |
| Yup'ik | 1.5 /100 | #255 | Tragic 5.7% |
| Immigrants | Turkey | 1.5 /100 | #256 | Tragic 5.7% |
| Immigrants | Northern Africa | 1.4 /100 | #257 | Tragic 5.6% |
| Immigrants | Lithuania | 1.4 /100 | #258 | Tragic 5.6% |
| Immigrants | France | 1.3 /100 | #259 | Tragic 5.6% |
| Uruguayans | 1.3 /100 | #260 | Tragic 5.6% |
| Sudanese | 1.2 /100 | #261 | Tragic 5.6% |
| Bermudans | 1.2 /100 | #262 | Tragic 5.6% |
| Immigrants | Saudi Arabia | 1.1 /100 | #263 | Tragic 5.6% |
| Immigrants | Africa | 1.0 /100 | #264 | Tragic 5.6% |
| South Americans | 0.9 /100 | #265 | Tragic 5.6% |
| Immigrants | Nepal | 0.9 /100 | #266 | Tragic 5.6% |