Alaskan Athabascan vs Croatian 4 or more Vehicles in Household
COMPARE
Alaskan Athabascan
Croatian
4 or more Vehicles in Household
4 or more Vehicles in Household Comparison
Alaskan Athabascans
Croatians
8.1%
4 OR MORE VEHICLES IN HOUSEHOLD
100.0/ 100
METRIC RATING
34th/ 347
METRIC RANK
6.5%
4 OR MORE VEHICLES IN HOUSEHOLD
77.8/ 100
METRIC RATING
145th/ 347
METRIC RANK
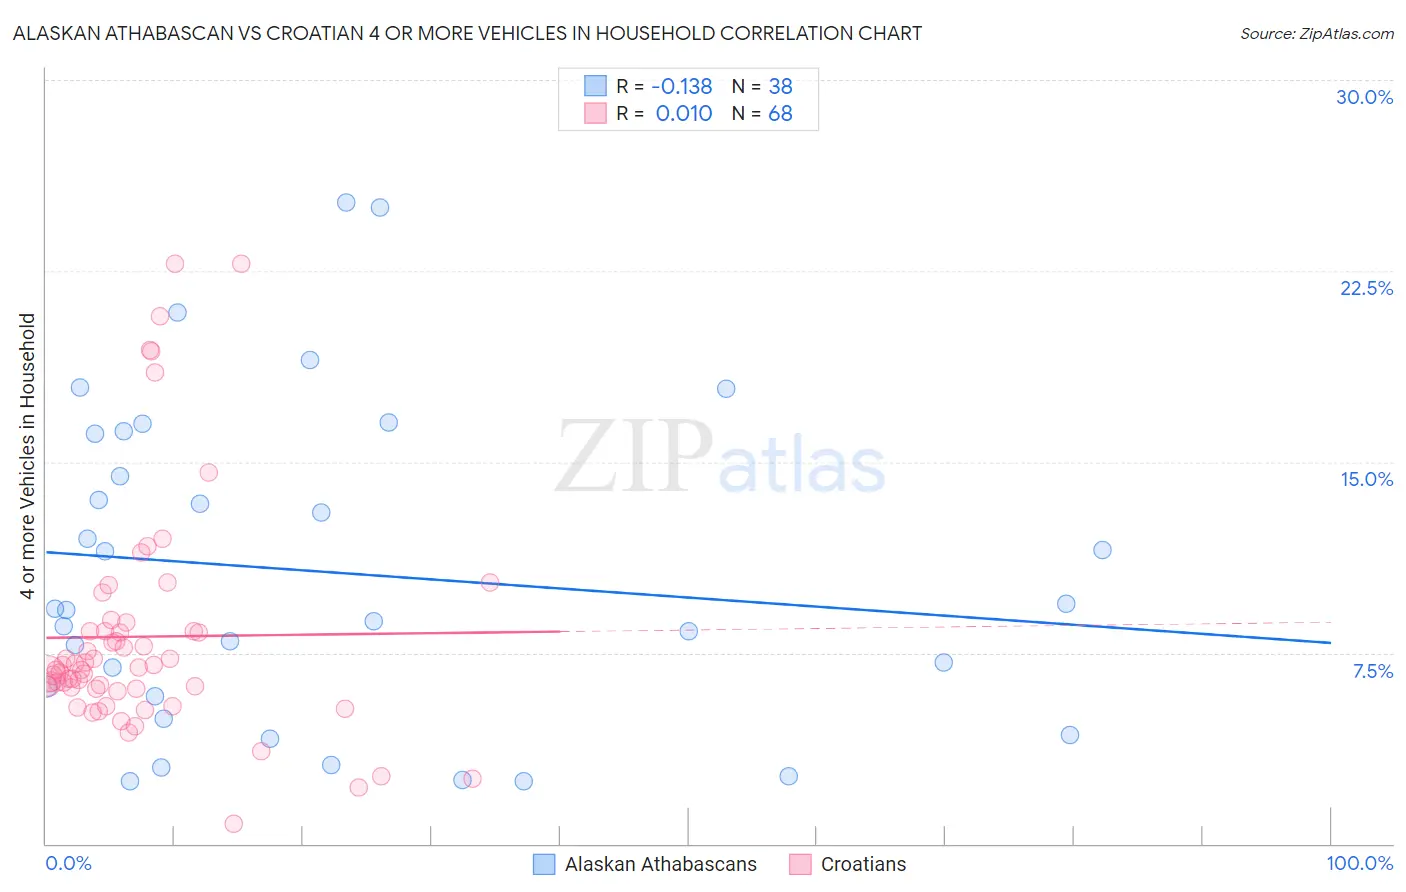
Alaskan Athabascan vs Croatian 4 or more Vehicles in Household Correlation Chart
The statistical analysis conducted on geographies consisting of 45,776,205 people shows a poor negative correlation between the proportion of Alaskan Athabascans and percentage of households with 4 or more vehicles available in the United States with a correlation coefficient (R) of -0.138 and weighted average of 8.1%. Similarly, the statistical analysis conducted on geographies consisting of 374,283,631 people shows no correlation between the proportion of Croatians and percentage of households with 4 or more vehicles available in the United States with a correlation coefficient (R) of 0.010 and weighted average of 6.5%, a difference of 23.7%.
4 or more Vehicles in Household Correlation Summary
| Measurement | Alaskan Athabascan | Croatian |
| Minimum | 2.4% | 0.78% |
| Maximum | 25.2% | 22.8% |
| Range | 22.8% | 22.0% |
| Mean | 10.7% | 8.1% |
| Median | 9.2% | 6.9% |
| Interquartile 25% (IQ1) | 5.8% | 6.1% |
| Interquartile 75% (IQ3) | 16.1% | 8.3% |
| Interquartile Range (IQR) | 10.3% | 2.3% |
| Standard Deviation (Sample) | 6.3% | 4.5% |
| Standard Deviation (Population) | 6.2% | 4.5% |
Similar Demographics by 4 or more Vehicles in Household
Demographics Similar to Alaskan Athabascans by 4 or more Vehicles in Household
In terms of 4 or more vehicles in household, the demographic groups most similar to Alaskan Athabascans are Guamanian/Chamorro (8.1%, a difference of 0.20%), Yaqui (8.1%, a difference of 0.60%), Marshallese (8.1%, a difference of 0.89%), Norwegian (8.0%, a difference of 0.99%), and Scandinavian (8.0%, a difference of 1.2%).
| Demographics | Rating | Rank | 4 or more Vehicles in Household |
| Sri Lankans | 100.0 /100 | #27 | Exceptional 8.4% |
| Cheyenne | 100.0 /100 | #28 | Exceptional 8.3% |
| Immigrants | South Eastern Asia | 100.0 /100 | #29 | Exceptional 8.2% |
| Navajo | 100.0 /100 | #30 | Exceptional 8.2% |
| Natives/Alaskans | 100.0 /100 | #31 | Exceptional 8.2% |
| Marshallese | 100.0 /100 | #32 | Exceptional 8.1% |
| Yaqui | 100.0 /100 | #33 | Exceptional 8.1% |
| Alaskan Athabascans | 100.0 /100 | #34 | Exceptional 8.1% |
| Guamanians/Chamorros | 100.0 /100 | #35 | Exceptional 8.1% |
| Norwegians | 100.0 /100 | #36 | Exceptional 8.0% |
| Scandinavians | 100.0 /100 | #37 | Exceptional 8.0% |
| Sioux | 100.0 /100 | #38 | Exceptional 8.0% |
| Spanish Americans | 100.0 /100 | #39 | Exceptional 8.0% |
| Spanish | 100.0 /100 | #40 | Exceptional 7.9% |
| Pima | 100.0 /100 | #41 | Exceptional 7.9% |
Demographics Similar to Croatians by 4 or more Vehicles in Household
In terms of 4 or more vehicles in household, the demographic groups most similar to Croatians are Immigrants from North America (6.5%, a difference of 0.10%), Immigrants from Canada (6.5%, a difference of 0.11%), Immigrants from Iraq (6.5%, a difference of 0.25%), Australian (6.6%, a difference of 0.45%), and Immigrants from Costa Rica (6.5%, a difference of 0.46%).
| Demographics | Rating | Rank | 4 or more Vehicles in Household |
| Italians | 84.5 /100 | #138 | Excellent 6.6% |
| Jordanians | 82.1 /100 | #139 | Excellent 6.6% |
| Slavs | 81.6 /100 | #140 | Excellent 6.6% |
| Australians | 80.8 /100 | #141 | Excellent 6.6% |
| Immigrants | Iraq | 79.4 /100 | #142 | Good 6.5% |
| Immigrants | Canada | 78.6 /100 | #143 | Good 6.5% |
| Immigrants | North America | 78.5 /100 | #144 | Good 6.5% |
| Croatians | 77.8 /100 | #145 | Good 6.5% |
| Immigrants | Costa Rica | 74.4 /100 | #146 | Good 6.5% |
| Immigrants | Iran | 73.9 /100 | #147 | Good 6.5% |
| Immigrants | Jordan | 73.7 /100 | #148 | Good 6.5% |
| Greeks | 73.6 /100 | #149 | Good 6.5% |
| New Zealanders | 73.3 /100 | #150 | Good 6.5% |
| Immigrants | Hong Kong | 72.2 /100 | #151 | Good 6.5% |
| Yuman | 72.1 /100 | #152 | Good 6.5% |