Zip Codes with the Highest Percentage of Population Employed in Arts, Media & Entertainment in Fort Worth, TX
RELATED REPORTS & OPTIONS
Arts, Media & Entertainment
Fort Worth
Compare Zip Codes
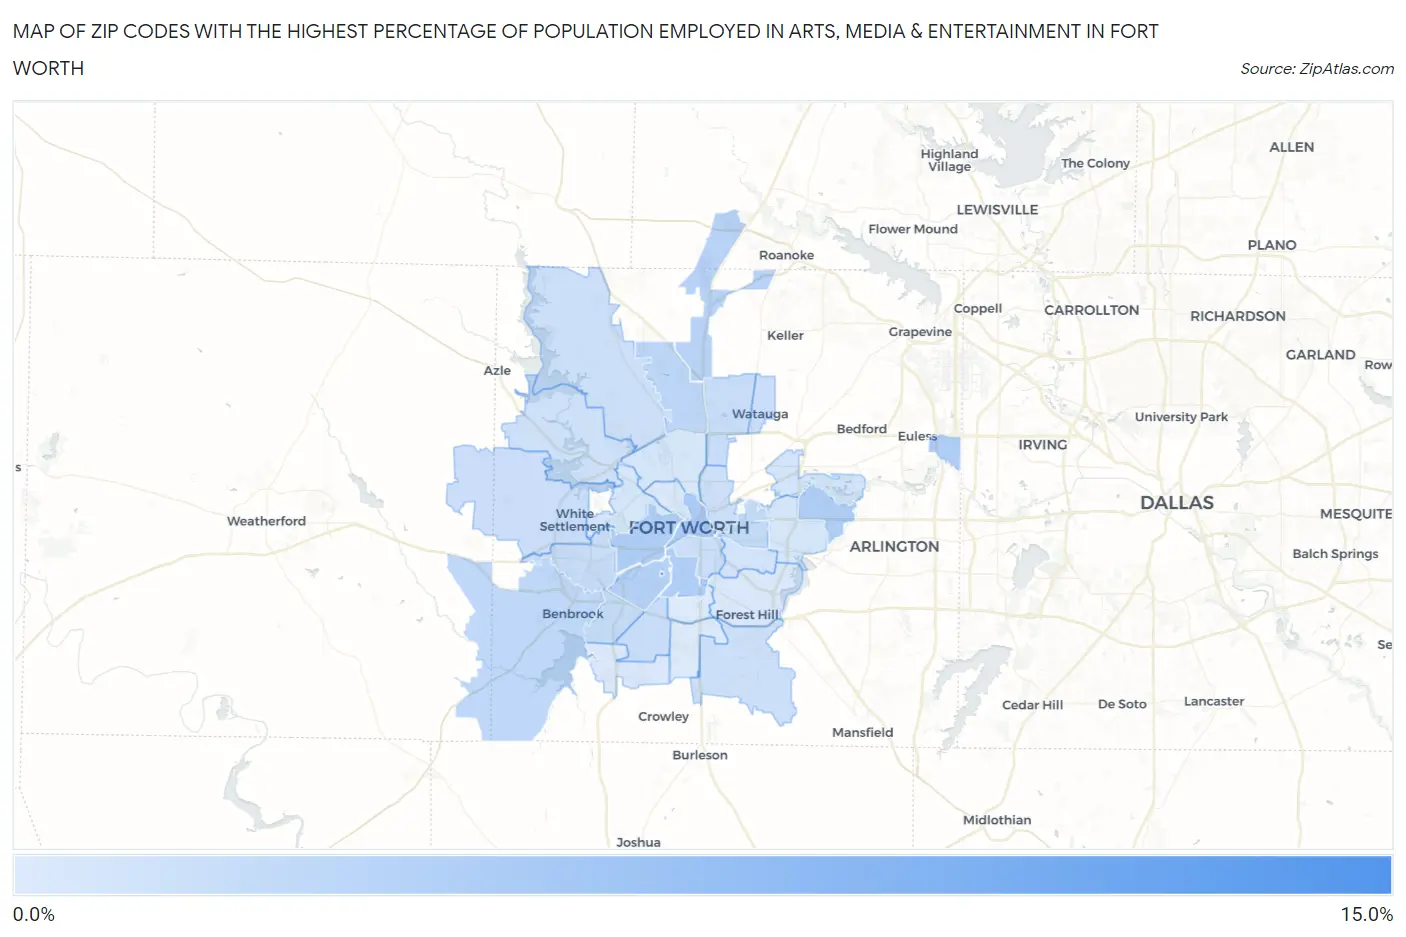
Map of Zip Codes with the Highest Percentage of Population Employed in Arts, Media & Entertainment in Fort Worth
0.26%
10.1%
Zip Codes with the Highest Percentage of Population Employed in Arts, Media & Entertainment in Fort Worth, TX
| Zip Code | % Employed | vs State | vs National | |
| 1. | 76129 | 10.1% | 1.7%(+8.48)#10 | 2.1%(+8.07)#367 |
| 2. | 76102 | 3.6% | 1.7%(+1.91)#112 | 2.1%(+1.50)#2,967 |
| 3. | 76107 | 3.3% | 1.7%(+1.61)#136 | 2.1%(+1.21)#3,482 |
| 4. | 76155 | 3.2% | 1.7%(+1.59)#138 | 2.1%(+1.18)#3,521 |
| 5. | 76120 | 3.2% | 1.7%(+1.57)#140 | 2.1%(+1.17)#3,551 |
| 6. | 76110 | 3.1% | 1.7%(+1.45)#157 | 2.1%(+1.05)#3,829 |
| 7. | 76109 | 2.7% | 1.7%(+1.08)#192 | 2.1%(+0.670)#4,817 |
| 8. | 76177 | 2.6% | 1.7%(+0.967)#218 | 2.1%(+0.562)#5,158 |
| 9. | 76131 | 2.3% | 1.7%(+0.674)#275 | 2.1%(+0.269)#6,240 |
| 10. | 76126 | 2.2% | 1.7%(+0.540)#312 | 2.1%(+0.135)#6,840 |
| 11. | 76103 | 1.9% | 1.7%(+0.215)#403 | 2.1%(-0.190)#8,549 |
| 12. | 76132 | 1.7% | 1.7%(+0.052)#463 | 2.1%(-0.353)#9,563 |
| 13. | 76116 | 1.6% | 1.7%(-0.013)#500 | 2.1%(-0.418)#10,039 |
| 14. | 76137 | 1.5% | 1.7%(-0.109)#547 | 2.1%(-0.514)#10,680 |
| 15. | 76133 | 1.5% | 1.7%(-0.128)#559 | 2.1%(-0.533)#10,796 |
| 16. | 76104 | 1.4% | 1.7%(-0.259)#612 | 2.1%(-0.664)#11,741 |
| 17. | 76108 | 1.4% | 1.7%(-0.273)#616 | 2.1%(-0.678)#11,829 |
| 18. | 76148 | 1.4% | 1.7%(-0.286)#623 | 2.1%(-0.691)#11,912 |
| 19. | 76140 | 1.3% | 1.7%(-0.323)#638 | 2.1%(-0.728)#12,215 |
| 20. | 76111 | 1.3% | 1.7%(-0.359)#653 | 2.1%(-0.764)#12,478 |
| 21. | 76179 | 1.3% | 1.7%(-0.389)#673 | 2.1%(-0.794)#12,705 |
| 22. | 76135 | 1.1% | 1.7%(-0.587)#764 | 2.1%(-0.992)#14,251 |
| 23. | 76105 | 0.97% | 1.7%(-0.689)#823 | 2.1%(-1.09)#15,086 |
| 24. | 76118 | 0.90% | 1.7%(-0.758)#864 | 2.1%(-1.16)#15,654 |
| 25. | 76106 | 0.66% | 1.7%(-0.992)#986 | 2.1%(-1.40)#17,548 |
| 26. | 76112 | 0.66% | 1.7%(-1.000)#989 | 2.1%(-1.40)#17,620 |
| 27. | 76114 | 0.64% | 1.7%(-1.01)#992 | 2.1%(-1.42)#17,723 |
| 28. | 76164 | 0.52% | 1.7%(-1.14)#1,056 | 2.1%(-1.54)#18,730 |
| 29. | 76123 | 0.45% | 1.7%(-1.20)#1,089 | 2.1%(-1.61)#19,277 |
| 30. | 76119 | 0.42% | 1.7%(-1.23)#1,100 | 2.1%(-1.64)#19,481 |
| 31. | 76115 | 0.28% | 1.7%(-1.37)#1,169 | 2.1%(-1.78)#20,447 |
| 32. | 76134 | 0.26% | 1.7%(-1.40)#1,176 | 2.1%(-1.80)#20,621 |
1
Common Questions
What are the Top 10 Zip Codes with the Highest Percentage of Population Employed in Arts, Media & Entertainment in Fort Worth, TX?
Top 10 Zip Codes with the Highest Percentage of Population Employed in Arts, Media & Entertainment in Fort Worth, TX are:
What zip code has the Highest Percentage of Population Employed in Arts, Media & Entertainment in Fort Worth, TX?
76129 has the Highest Percentage of Population Employed in Arts, Media & Entertainment in Fort Worth, TX with 10.1%.
What is the Percentage of Population Employed in Arts, Media & Entertainment in Fort Worth, TX?
Percentage of Population Employed in Arts, Media & Entertainment in Fort Worth is 1.5%.
What is the Percentage of Population Employed in Arts, Media & Entertainment in Texas?
Percentage of Population Employed in Arts, Media & Entertainment in Texas is 1.7%.
What is the Percentage of Population Employed in Arts, Media & Entertainment in the United States?
Percentage of Population Employed in Arts, Media & Entertainment in the United States is 2.1%.