Zip Codes with the Highest Percentage of Population Employed in Arts, Entertainment & Recreation in Fort Worth, TX
RELATED REPORTS & OPTIONS
Arts, Entertainment & Recreation
Fort Worth
Compare Zip Codes
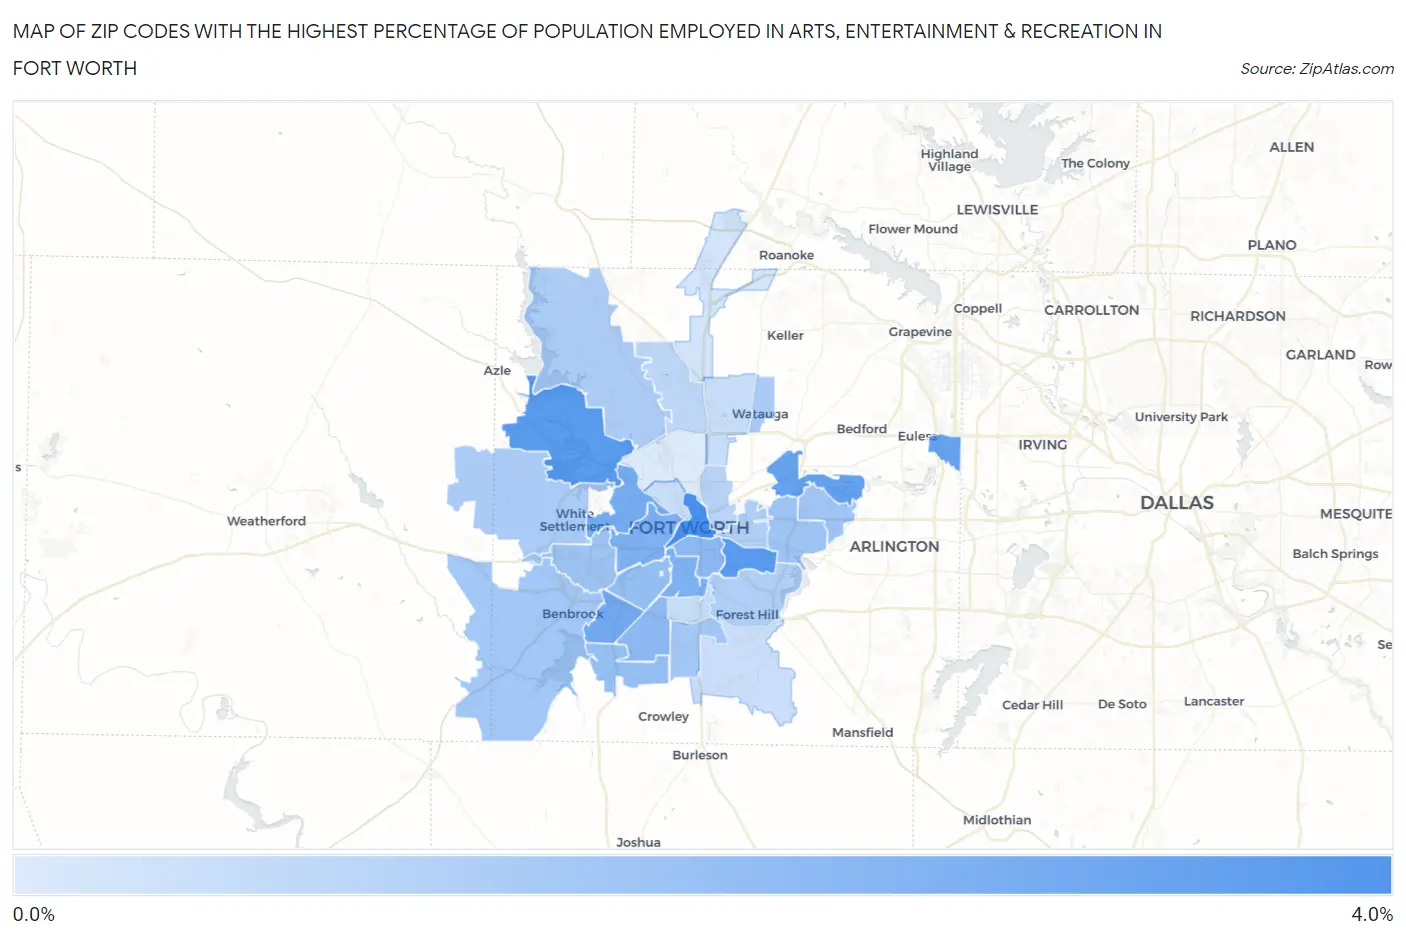
Map of Zip Codes with the Highest Percentage of Population Employed in Arts, Entertainment & Recreation in Fort Worth
0.31%
3.1%
Zip Codes with the Highest Percentage of Population Employed in Arts, Entertainment & Recreation in Fort Worth, TX
| Zip Code | % Employed | vs State | vs National | |
| 1. | 76102 | 3.1% | 1.5%(+1.62)#128 | 2.1%(+1.00)#5,106 |
| 2. | 76135 | 2.8% | 1.5%(+1.33)#175 | 2.1%(+0.707)#6,039 |
| 3. | 76105 | 2.8% | 1.5%(+1.31)#178 | 2.1%(+0.690)#6,094 |
| 4. | 76155 | 2.5% | 1.5%(+1.07)#221 | 2.1%(+0.447)#7,051 |
| 5. | 76118 | 2.5% | 1.5%(+1.06)#223 | 2.1%(+0.437)#7,091 |
| 6. | 76132 | 2.2% | 1.5%(+0.786)#278 | 2.1%(+0.166)#8,385 |
| 7. | 76114 | 2.2% | 1.5%(+0.763)#283 | 2.1%(+0.143)#8,487 |
| 8. | 76107 | 2.0% | 1.5%(+0.584)#341 | 2.1%(-0.036)#9,515 |
| 9. | 76110 | 2.0% | 1.5%(+0.570)#343 | 2.1%(-0.050)#9,589 |
| 10. | 76133 | 1.8% | 1.5%(+0.343)#425 | 2.1%(-0.277)#10,980 |
| 11. | 76104 | 1.8% | 1.5%(+0.323)#433 | 2.1%(-0.297)#11,119 |
| 12. | 76109 | 1.6% | 1.5%(+0.176)#488 | 2.1%(-0.444)#12,172 |
| 13. | 76123 | 1.6% | 1.5%(+0.164)#491 | 2.1%(-0.457)#12,243 |
| 14. | 76116 | 1.5% | 1.5%(-0.010)#581 | 2.1%(-0.630)#13,579 |
| 15. | 76112 | 1.4% | 1.5%(-0.026)#593 | 2.1%(-0.646)#13,715 |
| 16. | 76120 | 1.4% | 1.5%(-0.071)#618 | 2.1%(-0.691)#14,060 |
| 17. | 76126 | 1.4% | 1.5%(-0.088)#625 | 2.1%(-0.708)#14,181 |
| 18. | 76134 | 1.4% | 1.5%(-0.108)#632 | 2.1%(-0.728)#14,326 |
| 19. | 76108 | 1.3% | 1.5%(-0.203)#688 | 2.1%(-0.823)#15,031 |
| 20. | 76148 | 1.2% | 1.5%(-0.225)#701 | 2.1%(-0.845)#15,203 |
| 21. | 76179 | 1.2% | 1.5%(-0.251)#709 | 2.1%(-0.872)#15,388 |
| 22. | 76119 | 1.1% | 1.5%(-0.343)#759 | 2.1%(-0.963)#16,089 |
| 23. | 76103 | 1.1% | 1.5%(-0.350)#766 | 2.1%(-0.970)#16,135 |
| 24. | 76111 | 1.00% | 1.5%(-0.466)#830 | 2.1%(-1.09)#16,997 |
| 25. | 76131 | 0.89% | 1.5%(-0.577)#883 | 2.1%(-1.20)#17,793 |
| 26. | 76115 | 0.73% | 1.5%(-0.728)#946 | 2.1%(-1.35)#18,886 |
| 27. | 76164 | 0.70% | 1.5%(-0.758)#964 | 2.1%(-1.38)#19,108 |
| 28. | 76137 | 0.70% | 1.5%(-0.764)#968 | 2.1%(-1.38)#19,144 |
| 29. | 76140 | 0.66% | 1.5%(-0.806)#990 | 2.1%(-1.43)#19,448 |
| 30. | 76177 | 0.46% | 1.5%(-0.998)#1,092 | 2.1%(-1.62)#20,706 |
| 31. | 76106 | 0.31% | 1.5%(-1.15)#1,170 | 2.1%(-1.77)#21,666 |
1
Common Questions
What are the Top 10 Zip Codes with the Highest Percentage of Population Employed in Arts, Entertainment & Recreation in Fort Worth, TX?
Top 10 Zip Codes with the Highest Percentage of Population Employed in Arts, Entertainment & Recreation in Fort Worth, TX are:
What zip code has the Highest Percentage of Population Employed in Arts, Entertainment & Recreation in Fort Worth, TX?
76102 has the Highest Percentage of Population Employed in Arts, Entertainment & Recreation in Fort Worth, TX with 3.1%.
What is the Percentage of Population Employed in Arts, Entertainment & Recreation in Fort Worth, TX?
Percentage of Population Employed in Arts, Entertainment & Recreation in Fort Worth is 1.4%.
What is the Percentage of Population Employed in Arts, Entertainment & Recreation in Texas?
Percentage of Population Employed in Arts, Entertainment & Recreation in Texas is 1.5%.
What is the Percentage of Population Employed in Arts, Entertainment & Recreation in the United States?
Percentage of Population Employed in Arts, Entertainment & Recreation in the United States is 2.1%.