Zip Codes with the Oldest Female Population in Fort Worth, TX

RELATED REPORTS & OPTIONS

Oldest Population | Female
Population
Families and Households
Female Fertility
Female Fertility (Unmarried)
Race (Community Size)
Race (Percentage)
Ancestry (Community Size)
AfghanAfricanAlbanianAlsatianAmericanApacheArabArgentineanArmenianAustralianAustrianBahamianBangladeshiBarbadianBasqueBelgianBhutaneseBlackfeetBolivianBrazilianBritishBritish West IndianBulgarianBurmeseCajunCambodianCanadianCelticCentral AmericanCentral American IndianCherokeeCheyenneChickasawChileanChippewaChoctawColombianComancheCosta RicanCreekCroatianCrowCubanCzechCzechoslovakianDanishDelawareDominicanDutchDutch West IndianEastern EuropeanEcuadorianEgyptianEnglishEstonianEthiopianEuropeanFilipinoFinnishFrenchFrench American IndianFrench CanadianGermanGerman RussianGhanaianGreekGuamanian / ChamorroGuatemalanGuyaneseHaitianHonduranHopiHungarianIcelanderIndian (Asian)IndonesianInupiatIranianIraqiIrishIroquoisIsraeliItalianJamaicanJapaneseJordanianKenyanKiowaKoreanLaotianLatvianLebaneseLiberianLithuanianLuxembourgerMalaysianMalteseMexicanMexican American IndianMongolianMoroccanNative HawaiianNavajoNicaraguanNigerianNorthern EuropeanNorwegianOsageOttawaPakistaniPalestinianPanamanianPennsylvania GermanPeruvianPolishPortuguesePotawatomiPuebloPuerto RicanRomanianRussianSalvadoranSamoanScandinavianScotch-IrishScottishSerbianSiouxSlavicSlovakSloveneSomaliSouth AfricanSouth AmericanSouth American IndianSpaniardSpanishSpanish AmericanSpanish American IndianSri LankanSubsaharan AfricanSudaneseSwedishSwissSyrianThaiTonganTrinidadian and TobagonianTurkishUgandanUkrainianVenezuelanVietnameseWelshWest IndianYaquiYugoslavianZimbabwean
Ancestry (Percentage)
AfghanAfricanAlbanianAlsatianAmericanApacheArabArgentineanArmenianAustralianAustrianBahamianBangladeshiBarbadianBasqueBelgianBhutaneseBlackfeetBolivianBrazilianBritishBritish West IndianBulgarianBurmeseCajunCambodianCanadianCelticCentral AmericanCentral American IndianCherokeeCheyenneChickasawChileanChippewaChoctawColombianComancheCosta RicanCreekCroatianCrowCubanCzechCzechoslovakianDanishDelawareDominicanDutchDutch West IndianEastern EuropeanEcuadorianEgyptianEnglishEstonianEthiopianEuropeanFilipinoFinnishFrenchFrench American IndianFrench CanadianGermanGerman RussianGhanaianGreekGuamanian / ChamorroGuatemalanGuyaneseHaitianHonduranHopiHungarianIcelanderIndian (Asian)IndonesianInupiatIranianIraqiIrishIroquoisIsraeliItalianJamaicanJapaneseJordanianKenyanKiowaKoreanLaotianLatvianLebaneseLiberianLithuanianLuxembourgerMalaysianMalteseMexicanMexican American IndianMongolianMoroccanNative HawaiianNavajoNicaraguanNigerianNorthern EuropeanNorwegianOsageOttawaPakistaniPalestinianPanamanianPennsylvania GermanPeruvianPolishPortuguesePotawatomiPuebloPuerto RicanRomanianRussianSalvadoranSamoanScandinavianScotch-IrishScottishSerbianSiouxSlavicSlovakSloveneSomaliSouth AfricanSouth AmericanSouth American IndianSpaniardSpanishSpanish AmericanSpanish American IndianSri LankanSubsaharan AfricanSudaneseSwedishSwissSyrianThaiTonganTrinidadian and TobagonianTurkishUgandanUkrainianVenezuelanVietnameseWelshWest IndianYaquiYugoslavianZimbabwean
Immigrant Origin (Total)
AfghanistanAfricaAlbaniaArgentinaAsiaAustraliaBahamasBangladeshBarbadosBelarusBelizeBoliviaBosnia and HerzegovinaBrazilBulgariaBurma / MyanmarCambodiaCameroonCanadaCaribbeanCentral AmericaChileChinaColombiaCongoCosta RicaCroatiaCubaCzechoslovakiaDominican RepublicEastern AfricaEastern AsiaEastern EuropeEcuadorEgyptEl SalvadorEnglandEritreaEthiopiaEuropeFranceGermanyGhanaGreeceGuatemalaHaitiHondurasHong KongHungaryIndiaIndonesiaIranIraqIrelandIsraelItalyJamaicaJapanJordanKenyaKoreaLaosLatin AmericaLebanonLiberiaMalaysiaMexicoMicronesiaMiddle AfricaMoroccoNepalNetherlandsNicaraguaNigeriaNorthern AfricaNorthern EuropeOceaniaPakistanPanamaPeruPhilippinesPolandPortugalRomaniaRussiaScotlandSenegalSerbiaSomaliaSouth AfricaSouth AmericaSouth Central AsiaSouth Eastern AsiaSouthern EuropeSpainSri LankaSudanSwedenSwitzerlandSyriaTaiwanThailandTrinidad and TobagoTurkeyUgandaUkraineVenezuelaVietnamWestern AfricaWestern AsiaWestern EuropeZaireZimbabwe
Immigrant Origin (Percentage)
AfghanistanAfricaAlbaniaArgentinaAsiaAustraliaBahamasBangladeshBarbadosBelarusBelizeBoliviaBosnia and HerzegovinaBrazilBulgariaBurma / MyanmarCambodiaCameroonCanadaCaribbeanCentral AmericaChileChinaColombiaCongoCosta RicaCroatiaCubaCzechoslovakiaDominican RepublicEastern AfricaEastern AsiaEastern EuropeEcuadorEgyptEl SalvadorEnglandEritreaEthiopiaEuropeFranceGermanyGhanaGreeceGuatemalaHaitiHondurasHong KongHungaryIndiaIndonesiaIranIraqIrelandIsraelItalyJamaicaJapanJordanKenyaKoreaLaosLatin AmericaLebanonLiberiaMalaysiaMexicoMicronesiaMiddle AfricaMoroccoNepalNetherlandsNicaraguaNigeriaNorthern AfricaNorthern EuropeOceaniaPakistanPanamaPeruPhilippinesPolandPortugalRomaniaRussiaScotlandSenegalSerbiaSomaliaSouth AfricaSouth AmericaSouth Central AsiaSouth Eastern AsiaSouthern EuropeSpainSri LankaSudanSwedenSwitzerlandSyriaTaiwanThailandTrinidad and TobagoTurkeyUgandaUkraineVenezuelaVietnamWestern AfricaWestern AsiaWestern EuropeZaireZimbabwe
Income
Income (Families)
Income (Households)
Poverty
Poverty (Families)
Unemployment
Employment Occupations
Employment Industries
Employer Class
Commute Time
Commute Means
School Enrollment
Education by Degree Field
Occupancy
Finances
Physical Characteristics
Fort Worth
Compare Zip Codes
Comparison Subject

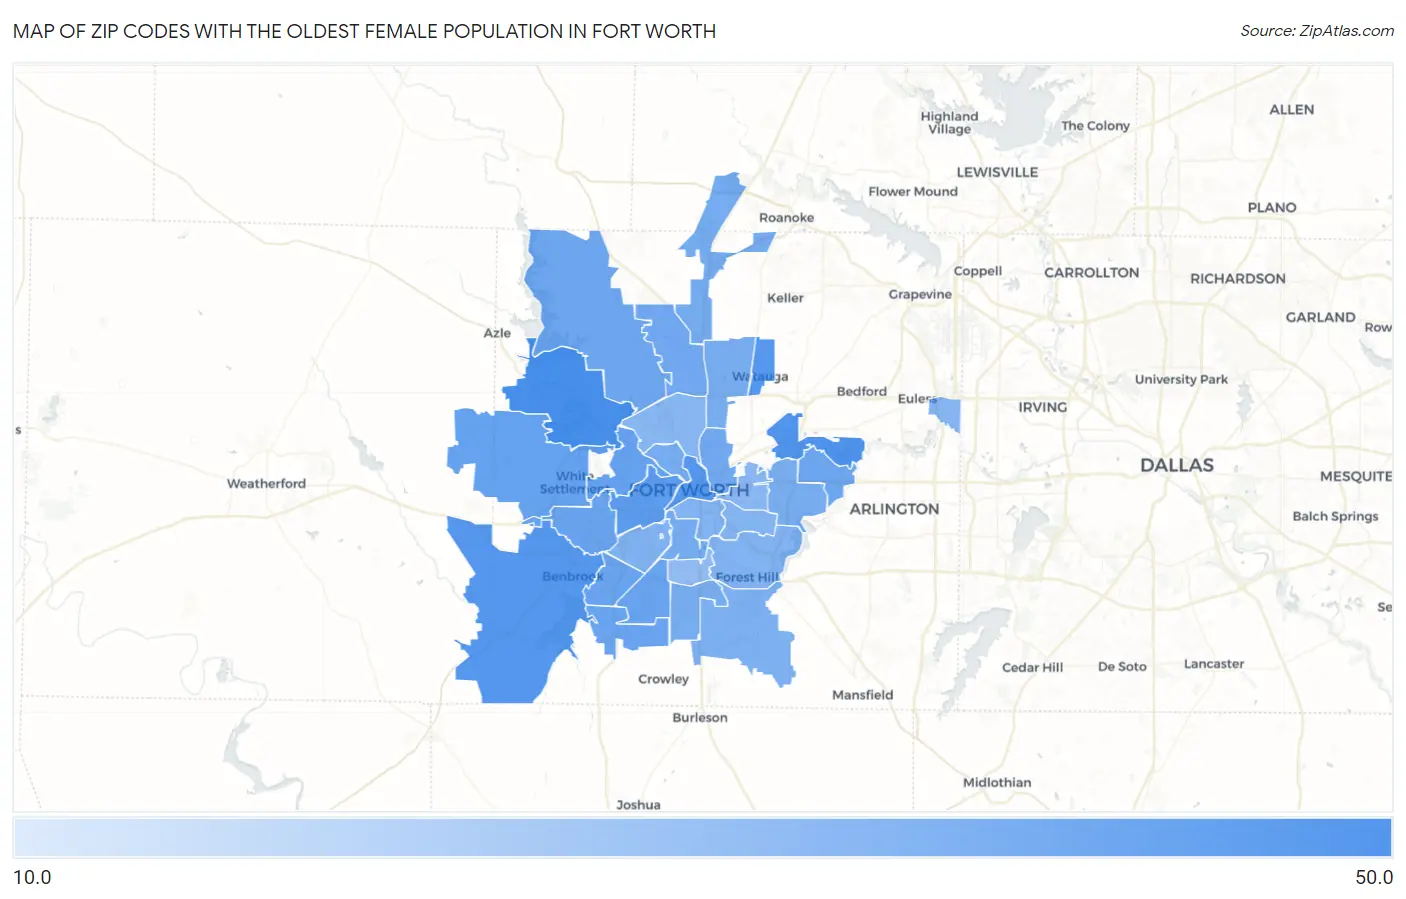
Map of Zip Codes with the Oldest Female Population in Fort Worth

0.0
50.0
Zip Codes with the Oldest Female Population in Fort Worth Map

Zip Codes with the Oldest Female Population in Fort Worth, TX

Zip Code Median Age vs State vs National
1.7613542.336.0(+6.30)#64539.7(+2.60)#17,219
2.7611841.036.0(+5.00)#73839.7(+1.30)#19,232
3.7614839.636.0(+3.60)#85939.7(-0.100)#21,417
4.7612639.536.0(+3.50)#87039.7(-0.200)#21,566
5.7610239.336.0(+3.30)#89739.7(-0.400)#21,919
6.7610738.336.0(+2.30)#98339.7(-1.40)#23,381
7.7610836.436.0(+0.400)#1,17739.7(-3.30)#25,719
8.7611436.336.0(+0.300)#1,19039.7(-3.40)#25,848
9.7613336.036.0(=0.000)#1,22239.7(-3.70)#26,135
10.7612335.536.0(-0.500)#1,28539.7(-4.20)#26,683
11.7611635.436.0(-0.600)#1,29639.7(-4.30)#26,801
12.7613235.436.0(-0.600)#1,30239.7(-4.30)#26,821
13.7612034.836.0(-1.20)#1,34639.7(-4.90)#27,389
14.7617934.536.0(-1.50)#1,37239.7(-5.20)#27,623
15.7613134.236.0(-1.80)#1,39039.7(-5.50)#27,854
16.7611134.236.0(-1.80)#1,39339.7(-5.50)#27,870
17.7616433.636.0(-2.40)#1,44839.7(-6.10)#28,337
18.7617733.536.0(-2.50)#1,45939.7(-6.20)#28,407
19.7611033.336.0(-2.70)#1,47339.7(-6.40)#28,564
20.7613433.236.0(-2.80)#1,48039.7(-6.50)#28,632
21.7613733.136.0(-2.90)#1,48439.7(-6.60)#28,669
22.7611232.936.0(-3.10)#1,50039.7(-6.80)#28,793
23.7614032.336.0(-3.70)#1,55239.7(-7.40)#29,180
24.7611931.736.0(-4.30)#1,59839.7(-8.00)#29,509
25.7610431.536.0(-4.50)#1,61139.7(-8.20)#29,620
26.7610931.436.0(-4.60)#1,61839.7(-8.30)#29,667
27.7610531.236.0(-4.80)#1,62839.7(-8.50)#29,760
28.7615530.736.0(-5.30)#1,65839.7(-9.00)#29,965
29.7610630.436.0(-5.60)#1,67939.7(-9.30)#30,072
30.7610330.136.0(-5.90)#1,69939.7(-9.60)#30,192
31.7611528.936.0(-7.10)#1,74039.7(-10.8)#30,540
32.7612919.636.0(-16.4)#1,85039.7(-20.1)#31,953

Common Questions

What are the Top 10 Zip Codes with the Oldest Female Population in Fort Worth, TX?
Top 10 Zip Codes with the Oldest Female Population in Fort Worth, TX are:
#1
42.3
#2
41.0
#3
39.6
#4
39.5
#5
39.3
#6
38.3
#7
36.4
#8
36.3
#9
36.0
#10
35.5
What zip code has the Oldest Female Population in Fort Worth, TX?
76135 has the Oldest Female Population in Fort Worth, TX with 42.3.
What is the Median Female Age in Fort Worth, TX?
Median Female Age in Fort Worth is 33.5.
What is the Median Female Age in Texas?
Median Female Age in Texas is 36.0.
What is the Median Female Age in the United States?
Median Female Age in the United States is 39.7.