Zip Codes with the Highest Percentage of Population Employed in Sales & Related in Fort Worth, TX
RELATED REPORTS & OPTIONS
Sales & Related
Fort Worth
Compare Zip Codes
Map of Zip Codes with the Highest Percentage of Population Employed in Sales & Related in Fort Worth
4.9%
14.2%
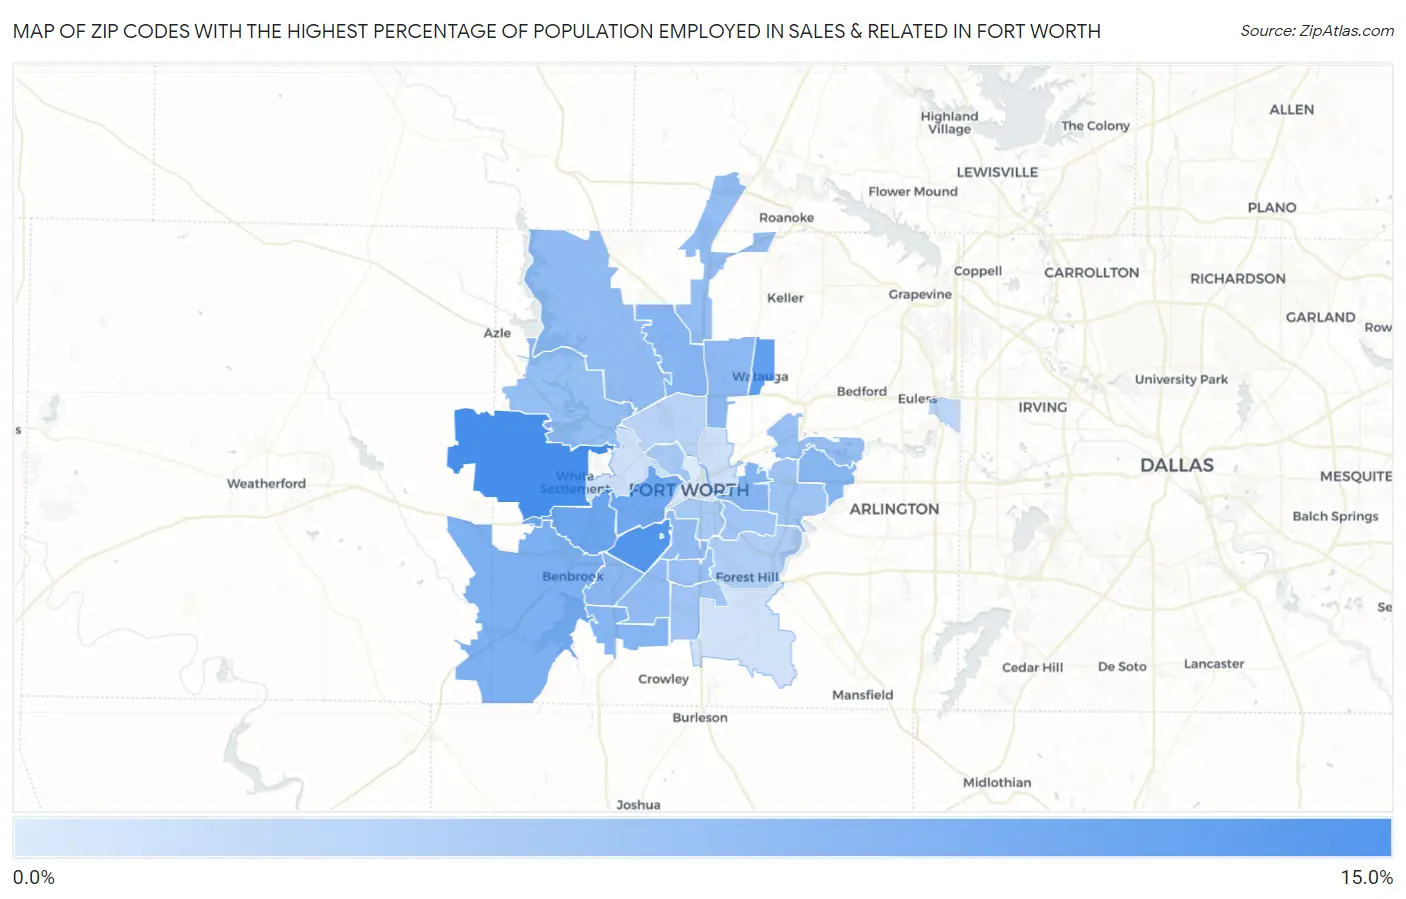
Zip Codes with the Highest Percentage of Population Employed in Sales & Related in Fort Worth, TX
| Zip Code | % Employed | vs State | vs National | |
| 1. | 76108 | 14.2% | 10.2%(+3.98)#202 | 9.6%(+4.61)#3,317 |
| 2. | 76109 | 13.4% | 10.2%(+3.22)#258 | 9.6%(+3.85)#3,994 |
| 3. | 76148 | 12.6% | 10.2%(+2.35)#353 | 9.6%(+2.98)#5,050 |
| 4. | 76116 | 11.9% | 10.2%(+1.66)#446 | 9.6%(+2.29)#6,264 |
| 5. | 76107 | 11.5% | 10.2%(+1.32)#494 | 9.6%(+1.95)#6,920 |
| 6. | 76126 | 10.8% | 10.2%(+0.570)#642 | 9.6%(+1.20)#8,743 |
| 7. | 76103 | 10.3% | 10.2%(+0.083)#723 | 9.6%(+0.712)#10,092 |
| 8. | 76123 | 10.3% | 10.2%(+0.062)#729 | 9.6%(+0.691)#10,154 |
| 9. | 76131 | 10.2% | 10.2%(-0.021)#747 | 9.6%(+0.608)#10,417 |
| 10. | 76120 | 10.1% | 10.2%(-0.128)#767 | 9.6%(+0.502)#10,721 |
| 11. | 76132 | 10.0% | 10.2%(-0.254)#801 | 9.6%(+0.375)#11,115 |
| 12. | 76137 | 9.8% | 10.2%(-0.463)#847 | 9.6%(+0.166)#11,813 |
| 13. | 76133 | 9.6% | 10.2%(-0.615)#898 | 9.6%(+0.014)#12,358 |
| 14. | 76110 | 9.6% | 10.2%(-0.659)#907 | 9.6%(-0.030)#12,517 |
| 15. | 76179 | 9.6% | 10.2%(-0.661)#908 | 9.6%(-0.032)#12,521 |
| 16. | 76177 | 9.3% | 10.2%(-0.893)#945 | 9.6%(-0.264)#13,322 |
| 17. | 76135 | 9.3% | 10.2%(-0.956)#956 | 9.6%(-0.327)#13,528 |
| 18. | 76118 | 9.2% | 10.2%(-1.07)#983 | 9.6%(-0.436)#13,950 |
| 19. | 76115 | 9.2% | 10.2%(-1.07)#984 | 9.6%(-0.437)#13,954 |
| 20. | 76112 | 8.8% | 10.2%(-1.47)#1,053 | 9.6%(-0.840)#15,420 |
| 21. | 76105 | 8.5% | 10.2%(-1.70)#1,102 | 9.6%(-1.07)#16,285 |
| 22. | 76134 | 8.5% | 10.2%(-1.74)#1,109 | 9.6%(-1.11)#16,397 |
| 23. | 76164 | 8.3% | 10.2%(-1.96)#1,154 | 9.6%(-1.33)#17,192 |
| 24. | 76104 | 8.1% | 10.2%(-2.16)#1,194 | 9.6%(-1.53)#17,853 |
| 25. | 76119 | 7.7% | 10.2%(-2.53)#1,238 | 9.6%(-1.90)#19,000 |
| 26. | 76129 | 7.2% | 10.2%(-3.02)#1,314 | 9.6%(-2.40)#20,632 |
| 27. | 76106 | 7.2% | 10.2%(-3.04)#1,319 | 9.6%(-2.41)#20,695 |
| 28. | 76155 | 6.8% | 10.2%(-3.41)#1,357 | 9.6%(-2.79)#21,701 |
| 29. | 76111 | 5.9% | 10.2%(-4.36)#1,447 | 9.6%(-3.73)#23,941 |
| 30. | 76114 | 5.7% | 10.2%(-4.51)#1,465 | 9.6%(-3.88)#24,227 |
| 31. | 76140 | 5.6% | 10.2%(-4.65)#1,484 | 9.6%(-4.02)#24,509 |
| 32. | 76102 | 4.9% | 10.2%(-5.29)#1,540 | 9.6%(-4.66)#25,688 |
1
Common Questions
What are the Top 10 Zip Codes with the Highest Percentage of Population Employed in Sales & Related in Fort Worth, TX?
Top 10 Zip Codes with the Highest Percentage of Population Employed in Sales & Related in Fort Worth, TX are:
What zip code has the Highest Percentage of Population Employed in Sales & Related in Fort Worth, TX?
76108 has the Highest Percentage of Population Employed in Sales & Related in Fort Worth, TX with 14.2%.
What is the Percentage of Population Employed in Sales & Related in Fort Worth, TX?
Percentage of Population Employed in Sales & Related in Fort Worth is 9.8%.
What is the Percentage of Population Employed in Sales & Related in Texas?
Percentage of Population Employed in Sales & Related in Texas is 10.2%.
What is the Percentage of Population Employed in Sales & Related in the United States?
Percentage of Population Employed in Sales & Related in the United States is 9.6%.