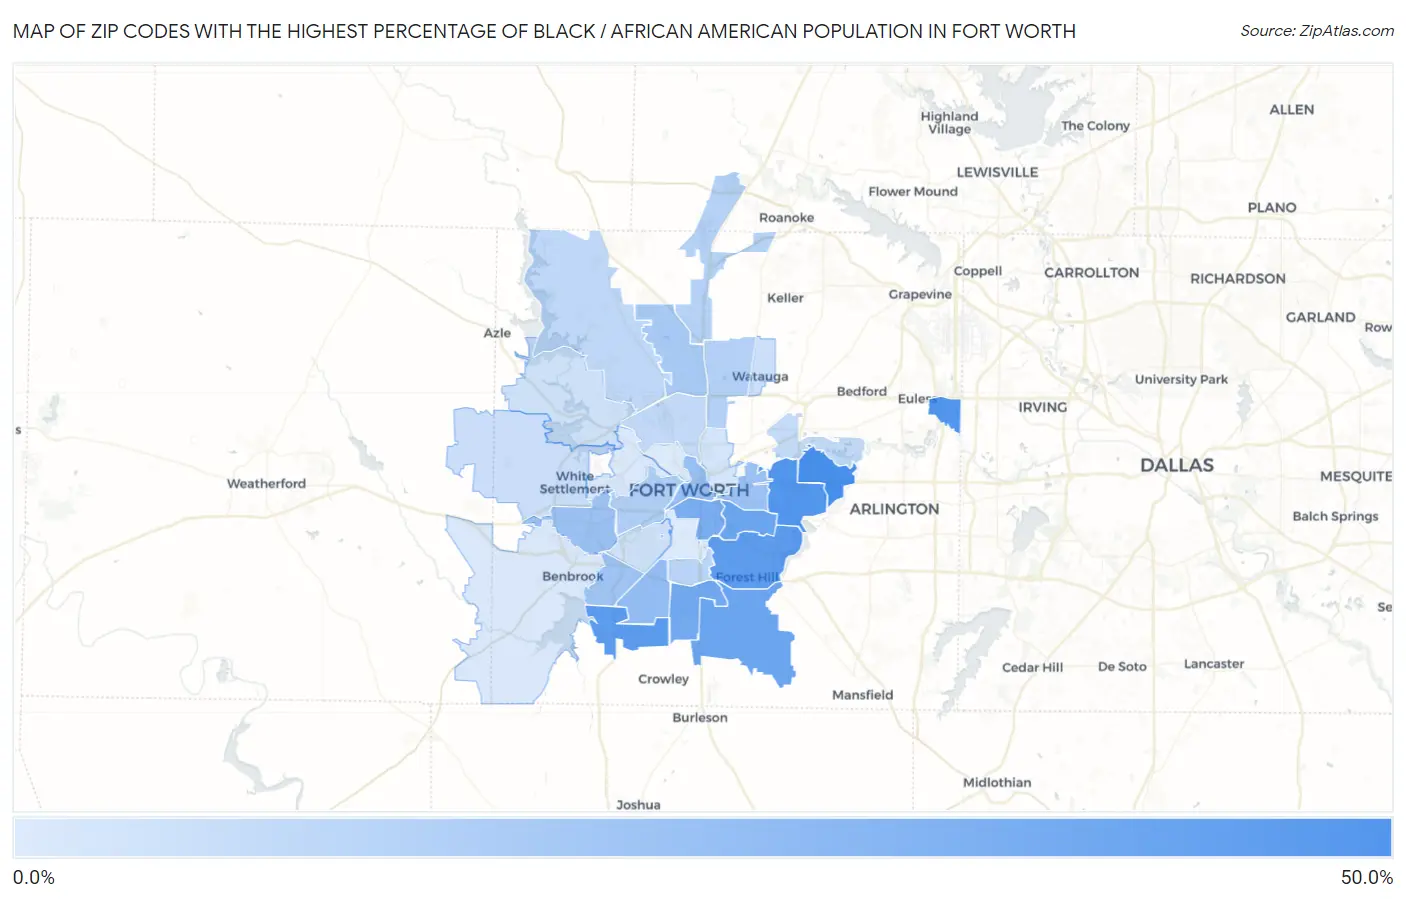
Zip Codes with the Highest Percentage of Black / African American Population in Fort Worth, TX
RELATED REPORTS & OPTIONS
Black / African American
Fort Worth
Compare Zip Codes
Map of Zip Codes with the Highest Percentage of Black / African American Population in Fort Worth
1.6%
46.1%
Zip Codes with the Highest Percentage of Black / African American Population in Fort Worth, TX
| Zip Code | Black / African American | vs State | vs National | |
| 1. | 76120 | 46.1% | 12.1%(+34.0)#48 | 12.5%(+33.6)#1,448 |
| 2. | 76112 | 42.1% | 12.1%(+30.0)#65 | 12.5%(+29.7)#1,687 |
| 3. | 76155 | 42.0% | 12.1%(+29.9)#66 | 12.5%(+29.6)#1,694 |
| 4. | 76123 | 39.8% | 12.1%(+27.6)#74 | 12.5%(+27.3)#1,867 |
| 5. | 76119 | 38.5% | 12.1%(+26.4)#79 | 12.5%(+26.0)#1,967 |
| 6. | 76105 | 33.8% | 12.1%(+21.6)#99 | 12.5%(+21.3)#2,319 |
| 7. | 76140 | 33.7% | 12.1%(+21.6)#100 | 12.5%(+21.2)#2,326 |
| 8. | 76134 | 31.1% | 12.1%(+18.9)#116 | 12.5%(+18.6)#2,552 |
| 9. | 76104 | 29.6% | 12.1%(+17.4)#129 | 12.5%(+17.1)#2,691 |
| 10. | 76133 | 21.8% | 12.1%(+9.67)#215 | 12.5%(+9.35)#3,666 |
| 11. | 76102 | 20.2% | 12.1%(+8.07)#240 | 12.5%(+7.75)#3,911 |
| 12. | 76116 | 19.5% | 12.1%(+7.38)#252 | 12.5%(+7.05)#4,040 |
| 13. | 76103 | 19.4% | 12.1%(+7.20)#255 | 12.5%(+6.88)#4,070 |
| 14. | 76132 | 17.7% | 12.1%(+5.53)#289 | 12.5%(+5.21)#4,378 |
| 15. | 76129 | 17.2% | 12.1%(+5.08)#299 | 12.5%(+4.76)#4,464 |
| 16. | 76131 | 15.5% | 12.1%(+3.34)#336 | 12.5%(+3.01)#4,836 |
| 17. | 76107 | 13.8% | 12.1%(+1.63)#395 | 12.5%(+1.31)#5,299 |
| 18. | 76137 | 12.5% | 12.1%(+0.397)#440 | 12.5%(+0.075)#5,684 |
| 19. | 76177 | 11.5% | 12.1%(-0.654)#485 | 12.5%(-0.976)#6,061 |
| 20. | 76115 | 10.8% | 12.1%(-1.37)#518 | 12.5%(-1.70)#6,326 |
| 21. | 76179 | 9.5% | 12.1%(-2.61)#577 | 12.5%(-2.93)#6,815 |
| 22. | 76106 | 8.9% | 12.1%(-3.21)#620 | 12.5%(-3.53)#7,065 |
| 23. | 76118 | 8.2% | 12.1%(-3.93)#653 | 12.5%(-4.25)#7,430 |
| 24. | 76108 | 6.5% | 12.1%(-5.61)#745 | 12.5%(-5.93)#8,385 |
| 25. | 76148 | 5.8% | 12.1%(-6.36)#791 | 12.5%(-6.69)#8,901 |
| 26. | 76109 | 5.1% | 12.1%(-7.06)#854 | 12.5%(-7.38)#9,485 |
| 27. | 76135 | 5.1% | 12.1%(-7.06)#855 | 12.5%(-7.39)#9,491 |
| 28. | 76111 | 3.8% | 12.1%(-8.38)#951 | 12.5%(-8.70)#10,753 |
| 29. | 76126 | 2.3% | 12.1%(-9.81)#1,107 | 12.5%(-10.1)#12,888 |
| 30. | 76114 | 1.9% | 12.1%(-10.3)#1,159 | 12.5%(-10.6)#13,850 |
| 31. | 76164 | 1.7% | 12.1%(-10.4)#1,183 | 12.5%(-10.7)#14,173 |
| 32. | 76110 | 1.6% | 12.1%(-10.5)#1,211 | 12.5%(-10.9)#14,530 |
1
Common Questions
What are the Top 10 Zip Codes with the Highest Percentage of Black / African American Population in Fort Worth, TX?
Top 10 Zip Codes with the Highest Percentage of Black / African American Population in Fort Worth, TX are:
What zip code has the Highest Percentage of Black / African American Population in Fort Worth, TX?
76120 has the Highest Percentage of Black / African American Population in Fort Worth, TX with 46.1%.
What is the Percentage of Black / African American Population in Fort Worth, TX?
Percentage of Black / African American Population in Fort Worth is 19.2%.
What is the Percentage of Black / African American Population in Texas?
Percentage of Black / African American Population in Texas is 12.1%.
What is the Percentage of Black / African American Population in the United States?
Percentage of Black / African American Population in the United States is 12.5%.