Zip Codes with the Highest Percentage of Population Enrolled in Nursery / Preschool in Fort Worth, TX

RELATED REPORTS & OPTIONS

Nursery / Preschool
Population
Families and Households
Female Fertility
Female Fertility (Unmarried)
Race (Community Size)
Race (Percentage)
Ancestry (Community Size)
AfghanAfricanAlbanianAlsatianAmericanApacheArabArgentineanArmenianAustralianAustrianBahamianBangladeshiBarbadianBasqueBelgianBhutaneseBlackfeetBolivianBrazilianBritishBritish West IndianBulgarianBurmeseCajunCambodianCanadianCelticCentral AmericanCentral American IndianCherokeeCheyenneChickasawChileanChippewaChoctawColombianComancheCosta RicanCreekCroatianCrowCubanCzechCzechoslovakianDanishDelawareDominicanDutchDutch West IndianEastern EuropeanEcuadorianEgyptianEnglishEstonianEthiopianEuropeanFilipinoFinnishFrenchFrench American IndianFrench CanadianGermanGerman RussianGhanaianGreekGuamanian / ChamorroGuatemalanGuyaneseHaitianHonduranHopiHungarianIcelanderIndian (Asian)IndonesianInupiatIranianIraqiIrishIroquoisIsraeliItalianJamaicanJapaneseJordanianKenyanKiowaKoreanLaotianLatvianLebaneseLiberianLithuanianLuxembourgerMalaysianMalteseMexicanMexican American IndianMongolianMoroccanNative HawaiianNavajoNicaraguanNigerianNorthern EuropeanNorwegianOsageOttawaPakistaniPalestinianPanamanianPennsylvania GermanPeruvianPolishPortuguesePotawatomiPuebloPuerto RicanRomanianRussianSalvadoranSamoanScandinavianScotch-IrishScottishSerbianSiouxSlavicSlovakSloveneSomaliSouth AfricanSouth AmericanSouth American IndianSpaniardSpanishSpanish AmericanSpanish American IndianSri LankanSubsaharan AfricanSudaneseSwedishSwissSyrianThaiTonganTrinidadian and TobagonianTurkishUgandanUkrainianVenezuelanVietnameseWelshWest IndianYaquiYugoslavianZimbabwean
Ancestry (Percentage)
AfghanAfricanAlbanianAlsatianAmericanApacheArabArgentineanArmenianAustralianAustrianBahamianBangladeshiBarbadianBasqueBelgianBhutaneseBlackfeetBolivianBrazilianBritishBritish West IndianBulgarianBurmeseCajunCambodianCanadianCelticCentral AmericanCentral American IndianCherokeeCheyenneChickasawChileanChippewaChoctawColombianComancheCosta RicanCreekCroatianCrowCubanCzechCzechoslovakianDanishDelawareDominicanDutchDutch West IndianEastern EuropeanEcuadorianEgyptianEnglishEstonianEthiopianEuropeanFilipinoFinnishFrenchFrench American IndianFrench CanadianGermanGerman RussianGhanaianGreekGuamanian / ChamorroGuatemalanGuyaneseHaitianHonduranHopiHungarianIcelanderIndian (Asian)IndonesianInupiatIranianIraqiIrishIroquoisIsraeliItalianJamaicanJapaneseJordanianKenyanKiowaKoreanLaotianLatvianLebaneseLiberianLithuanianLuxembourgerMalaysianMalteseMexicanMexican American IndianMongolianMoroccanNative HawaiianNavajoNicaraguanNigerianNorthern EuropeanNorwegianOsageOttawaPakistaniPalestinianPanamanianPennsylvania GermanPeruvianPolishPortuguesePotawatomiPuebloPuerto RicanRomanianRussianSalvadoranSamoanScandinavianScotch-IrishScottishSerbianSiouxSlavicSlovakSloveneSomaliSouth AfricanSouth AmericanSouth American IndianSpaniardSpanishSpanish AmericanSpanish American IndianSri LankanSubsaharan AfricanSudaneseSwedishSwissSyrianThaiTonganTrinidadian and TobagonianTurkishUgandanUkrainianVenezuelanVietnameseWelshWest IndianYaquiYugoslavianZimbabwean
Immigrant Origin (Total)
AfghanistanAfricaAlbaniaArgentinaAsiaAustraliaBahamasBangladeshBarbadosBelarusBelizeBoliviaBosnia and HerzegovinaBrazilBulgariaBurma / MyanmarCambodiaCameroonCanadaCaribbeanCentral AmericaChileChinaColombiaCongoCosta RicaCroatiaCubaCzechoslovakiaDominican RepublicEastern AfricaEastern AsiaEastern EuropeEcuadorEgyptEl SalvadorEnglandEritreaEthiopiaEuropeFranceGermanyGhanaGreeceGuatemalaHaitiHondurasHong KongHungaryIndiaIndonesiaIranIraqIrelandIsraelItalyJamaicaJapanJordanKenyaKoreaLaosLatin AmericaLebanonLiberiaMalaysiaMexicoMicronesiaMiddle AfricaMoroccoNepalNetherlandsNicaraguaNigeriaNorthern AfricaNorthern EuropeOceaniaPakistanPanamaPeruPhilippinesPolandPortugalRomaniaRussiaScotlandSenegalSerbiaSomaliaSouth AfricaSouth AmericaSouth Central AsiaSouth Eastern AsiaSouthern EuropeSpainSri LankaSudanSwedenSwitzerlandSyriaTaiwanThailandTrinidad and TobagoTurkeyUgandaUkraineVenezuelaVietnamWestern AfricaWestern AsiaWestern EuropeZaireZimbabwe
Immigrant Origin (Percentage)
AfghanistanAfricaAlbaniaArgentinaAsiaAustraliaBahamasBangladeshBarbadosBelarusBelizeBoliviaBosnia and HerzegovinaBrazilBulgariaBurma / MyanmarCambodiaCameroonCanadaCaribbeanCentral AmericaChileChinaColombiaCongoCosta RicaCroatiaCubaCzechoslovakiaDominican RepublicEastern AfricaEastern AsiaEastern EuropeEcuadorEgyptEl SalvadorEnglandEritreaEthiopiaEuropeFranceGermanyGhanaGreeceGuatemalaHaitiHondurasHong KongHungaryIndiaIndonesiaIranIraqIrelandIsraelItalyJamaicaJapanJordanKenyaKoreaLaosLatin AmericaLebanonLiberiaMalaysiaMexicoMicronesiaMiddle AfricaMoroccoNepalNetherlandsNicaraguaNigeriaNorthern AfricaNorthern EuropeOceaniaPakistanPanamaPeruPhilippinesPolandPortugalRomaniaRussiaScotlandSenegalSerbiaSomaliaSouth AfricaSouth AmericaSouth Central AsiaSouth Eastern AsiaSouthern EuropeSpainSri LankaSudanSwedenSwitzerlandSyriaTaiwanThailandTrinidad and TobagoTurkeyUgandaUkraineVenezuelaVietnamWestern AfricaWestern AsiaWestern EuropeZaireZimbabwe
Income
Income (Families)
Income (Households)
Poverty
Poverty (Families)
Unemployment
Employment Occupations
Employment Industries
Employer Class
Commute Time
Commute Means
School Enrollment
Education by Degree Field
Occupancy
Finances
Physical Characteristics
Fort Worth
Compare Zip Codes
Comparison Subject

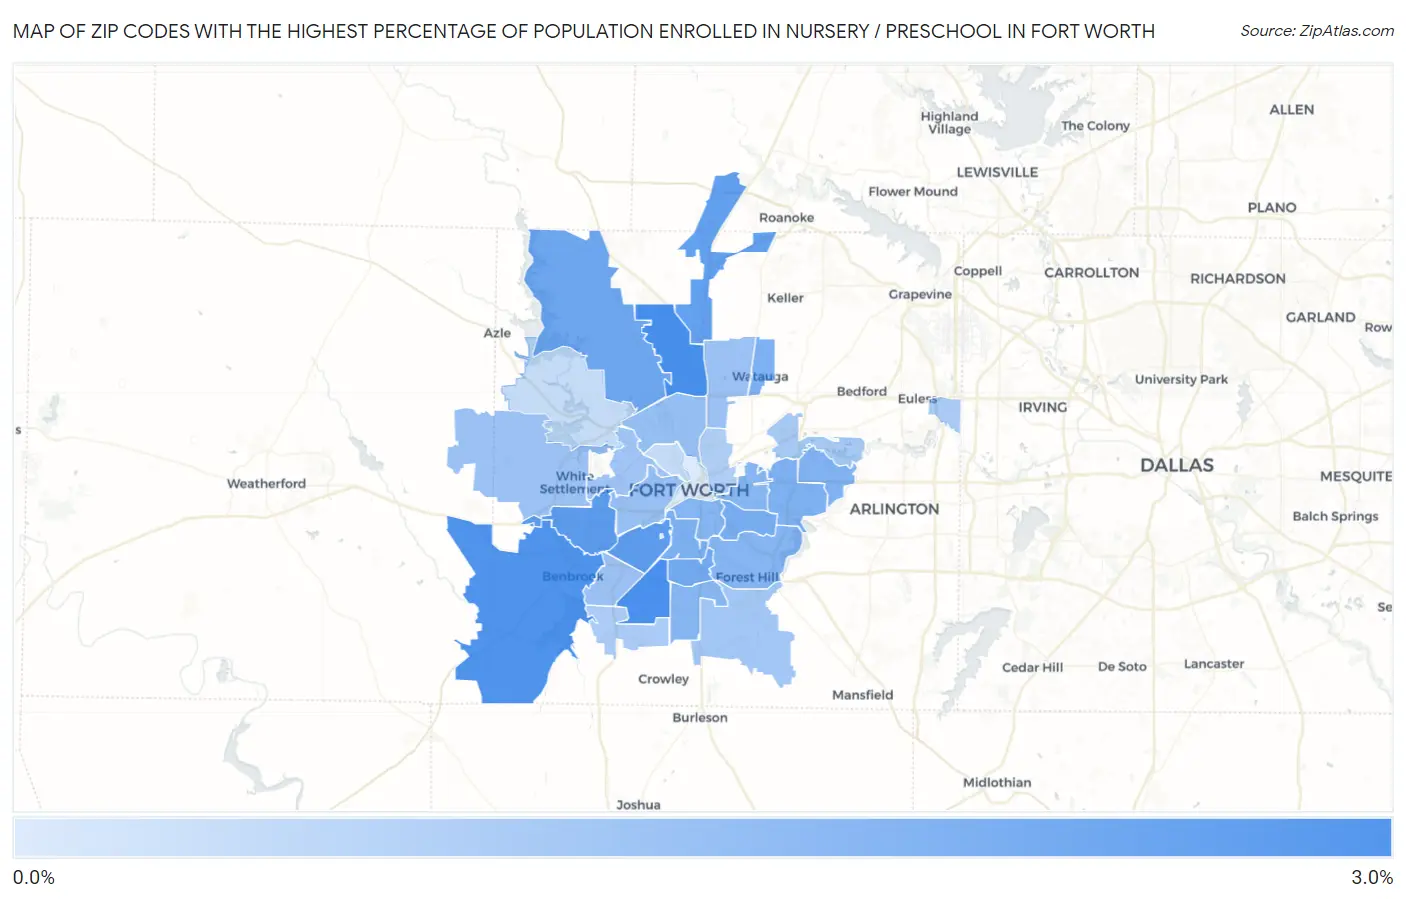
Map of Zip Codes with the Highest Percentage of Population Enrolled in Nursery / Preschool in Fort Worth

0.0%
3.0%
Zip Codes with the Highest Percentage of Population Enrolled in Nursery / Preschool in Fort Worth Map

Zip Codes with the Highest Percentage of Population Enrolled in Nursery / Preschool in Fort Worth, TX

Zip Code % in Nursery vs State vs National
1.761312.6%1.5%(+1.05)#1661.4%(+1.13)#3,265
2.761332.5%1.5%(+1.00)#1751.4%(+1.08)#3,418
3.761262.4%1.5%(+0.918)#1951.4%(+0.998)#3,725
4.761162.2%1.5%(+0.716)#2421.4%(+0.796)#4,587
5.761092.2%1.5%(+0.671)#2601.4%(+0.751)#4,832
6.761772.1%1.5%(+0.590)#2941.4%(+0.671)#5,277
7.761791.9%1.5%(+0.368)#4101.4%(+0.449)#6,864
8.761151.8%1.5%(+0.314)#4421.4%(+0.395)#7,346
9.761051.8%1.5%(+0.238)#4921.4%(+0.318)#8,065
10.761101.7%1.5%(+0.150)#5331.4%(+0.230)#8,949
11.761481.7%1.5%(+0.129)#5521.4%(+0.209)#9,218
12.761121.6%1.5%(+0.118)#5661.4%(+0.199)#9,333
13.761201.6%1.5%(+0.058)#6071.4%(+0.139)#9,988
14.761191.5%1.5%(-0.000)#6451.4%(+0.080)#10,658
15.761041.5%1.5%(-0.011)#6531.4%(+0.070)#10,773
16.761341.5%1.5%(-0.031)#6691.4%(+0.049)#11,020
17.761031.5%1.5%(-0.034)#6741.4%(+0.046)#11,064
18.761061.2%1.5%(-0.290)#8771.4%(-0.210)#14,369
19.761071.2%1.5%(-0.326)#9051.4%(-0.246)#14,847
20.761081.2%1.5%(-0.342)#9221.4%(-0.262)#15,072
21.761371.2%1.5%(-0.371)#9381.4%(-0.291)#15,464
22.761321.1%1.5%(-0.381)#9451.4%(-0.301)#15,606
23.761141.1%1.5%(-0.472)#1,0251.4%(-0.392)#16,784
24.761401.0%1.5%(-0.525)#1,0661.4%(-0.444)#17,523
25.761180.92%1.5%(-0.603)#1,1221.4%(-0.523)#18,501
26.761230.90%1.5%(-0.631)#1,1371.4%(-0.550)#18,857
27.761550.89%1.5%(-0.642)#1,1511.4%(-0.561)#18,997
28.761110.83%1.5%(-0.696)#1,1791.4%(-0.616)#19,632
29.761640.49%1.5%(-1.04)#1,3841.4%(-0.959)#23,133
30.761350.44%1.5%(-1.09)#1,4091.4%(-1.01)#23,541
31.761020.061%1.5%(-1.47)#1,5071.4%(-1.39)#25,626

Common Questions

What are the Top 10 Zip Codes with the Highest Percentage of Population Enrolled in Nursery / Preschool in Fort Worth, TX?
Top 10 Zip Codes with the Highest Percentage of Population Enrolled in Nursery / Preschool in Fort Worth, TX are:
#1
2.6%
#2
2.5%
#3
2.4%
#4
2.2%
#5
2.2%
#6
2.1%
#7
1.9%
#8
1.8%
#9
1.8%
#10
1.7%
What zip code has the Highest Percentage of Population Enrolled in Nursery / Preschool in Fort Worth, TX?
76131 has the Highest Percentage of Population Enrolled in Nursery / Preschool in Fort Worth, TX with 2.6%.
What is the Percentage of Population Enrolled in Nursery / Preschool in Fort Worth, TX?
Percentage of Population Enrolled in Nursery / Preschool in Fort Worth is 1.7%.
What is the Percentage of Population Enrolled in Nursery / Preschool in Texas?
Percentage of Population Enrolled in Nursery / Preschool in Texas is 1.5%.
What is the Percentage of Population Enrolled in Nursery / Preschool in the United States?
Percentage of Population Enrolled in Nursery / Preschool in the United States is 1.4%.