Zip Codes with the Highest Percentage of Population Employed in Professional & Scientific Services in Fort Worth, TX
RELATED REPORTS & OPTIONS
Professional & Scientific Services
Fort Worth
Compare Zip Codes
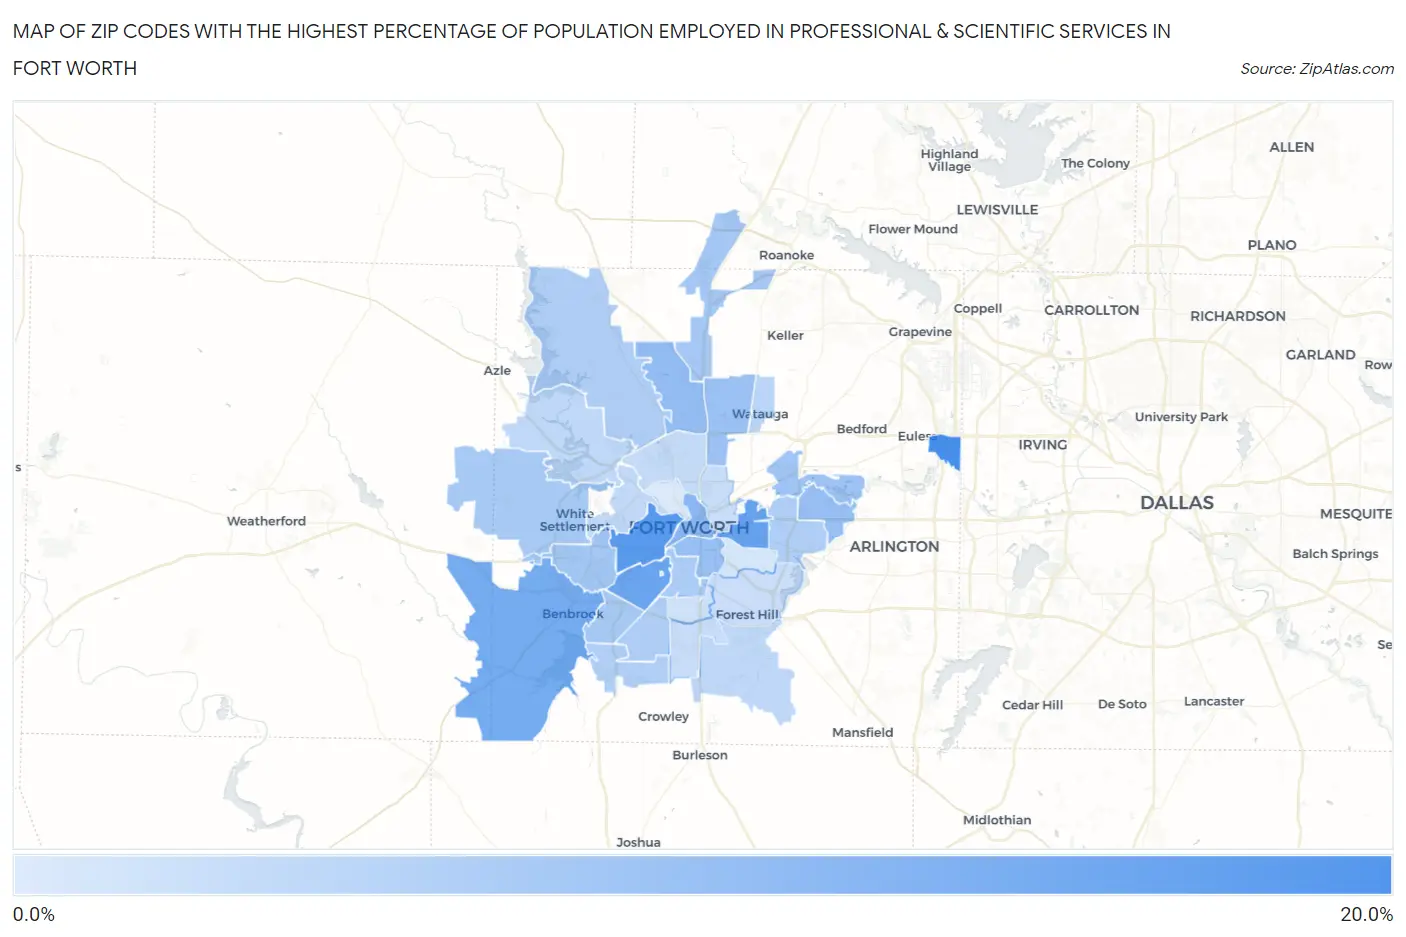
Map of Zip Codes with the Highest Percentage of Population Employed in Professional & Scientific Services in Fort Worth
0.83%
15.3%
Zip Codes with the Highest Percentage of Population Employed in Professional & Scientific Services in Fort Worth, TX
| Zip Code | % Employed | vs State | vs National | |
| 1. | 76155 | 15.3% | 7.6%(+7.68)#108 | 7.8%(+7.44)#1,808 |
| 2. | 76107 | 13.5% | 7.6%(+5.92)#146 | 7.8%(+5.68)#2,478 |
| 3. | 76103 | 12.2% | 7.6%(+4.56)#174 | 7.8%(+4.32)#3,106 |
| 4. | 76109 | 11.6% | 7.6%(+4.02)#188 | 7.8%(+3.78)#3,430 |
| 5. | 76126 | 10.6% | 7.6%(+3.02)#217 | 7.8%(+2.78)#4,089 |
| 6. | 76102 | 8.6% | 7.6%(+1.03)#302 | 7.8%(+0.781)#5,886 |
| 7. | 76131 | 7.7% | 7.6%(+0.089)#379 | 7.8%(-0.157)#7,083 |
| 8. | 76104 | 7.2% | 7.6%(-0.382)#416 | 7.8%(-0.628)#7,776 |
| 9. | 76120 | 7.2% | 7.6%(-0.447)#422 | 7.8%(-0.694)#7,891 |
| 10. | 76137 | 6.9% | 7.6%(-0.695)#443 | 7.8%(-0.942)#8,322 |
| 11. | 76118 | 6.5% | 7.6%(-1.12)#484 | 7.8%(-1.37)#9,078 |
| 12. | 76116 | 6.1% | 7.6%(-1.47)#521 | 7.8%(-1.71)#9,712 |
| 13. | 76177 | 6.0% | 7.6%(-1.64)#544 | 7.8%(-1.89)#10,060 |
| 14. | 76108 | 5.8% | 7.6%(-1.80)#566 | 7.8%(-2.04)#10,342 |
| 15. | 76132 | 5.8% | 7.6%(-1.84)#571 | 7.8%(-2.09)#10,440 |
| 16. | 76110 | 5.3% | 7.6%(-2.32)#656 | 7.8%(-2.56)#11,600 |
| 17. | 76179 | 5.1% | 7.6%(-2.50)#679 | 7.8%(-2.74)#12,061 |
| 18. | 76133 | 5.0% | 7.6%(-2.63)#703 | 7.8%(-2.88)#12,398 |
| 19. | 76123 | 4.8% | 7.6%(-2.80)#734 | 7.8%(-3.04)#12,815 |
| 20. | 76112 | 4.8% | 7.6%(-2.85)#752 | 7.8%(-3.09)#12,969 |
| 21. | 76148 | 4.1% | 7.6%(-3.54)#887 | 7.8%(-3.78)#14,923 |
| 22. | 76129 | 3.7% | 7.6%(-3.87)#937 | 7.8%(-4.11)#15,939 |
| 23. | 76140 | 3.6% | 7.6%(-4.05)#982 | 7.8%(-4.29)#16,535 |
| 24. | 76135 | 3.5% | 7.6%(-4.08)#992 | 7.8%(-4.33)#16,684 |
| 25. | 76114 | 3.3% | 7.6%(-4.27)#1,030 | 7.8%(-4.52)#17,303 |
| 26. | 76106 | 3.2% | 7.6%(-4.36)#1,044 | 7.8%(-4.60)#17,587 |
| 27. | 76111 | 2.8% | 7.6%(-4.79)#1,126 | 7.8%(-5.04)#19,113 |
| 28. | 76134 | 2.8% | 7.6%(-4.85)#1,141 | 7.8%(-5.10)#19,325 |
| 29. | 76119 | 2.6% | 7.6%(-5.03)#1,174 | 7.8%(-5.28)#19,947 |
| 30. | 76115 | 2.2% | 7.6%(-5.43)#1,269 | 7.8%(-5.68)#21,352 |
| 31. | 76105 | 1.5% | 7.6%(-6.14)#1,385 | 7.8%(-6.39)#23,655 |
| 32. | 76164 | 0.83% | 7.6%(-6.77)#1,483 | 7.8%(-7.02)#25,487 |
1
Common Questions
What are the Top 10 Zip Codes with the Highest Percentage of Population Employed in Professional & Scientific Services in Fort Worth, TX?
Top 10 Zip Codes with the Highest Percentage of Population Employed in Professional & Scientific Services in Fort Worth, TX are:
What zip code has the Highest Percentage of Population Employed in Professional & Scientific Services in Fort Worth, TX?
76155 has the Highest Percentage of Population Employed in Professional & Scientific Services in Fort Worth, TX with 15.3%.
What is the Percentage of Population Employed in Professional & Scientific Services in Fort Worth, TX?
Percentage of Population Employed in Professional & Scientific Services in Fort Worth is 6.1%.
What is the Percentage of Population Employed in Professional & Scientific Services in Texas?
Percentage of Population Employed in Professional & Scientific Services in Texas is 7.6%.
What is the Percentage of Population Employed in Professional & Scientific Services in the United States?
Percentage of Population Employed in Professional & Scientific Services in the United States is 7.8%.