Zip Codes with the Highest Percentage of Population Employed in Health Care & Social Assistance in Fort Worth, TX
RELATED REPORTS & OPTIONS
Health Care & Social Assistance
Fort Worth
Compare Zip Codes
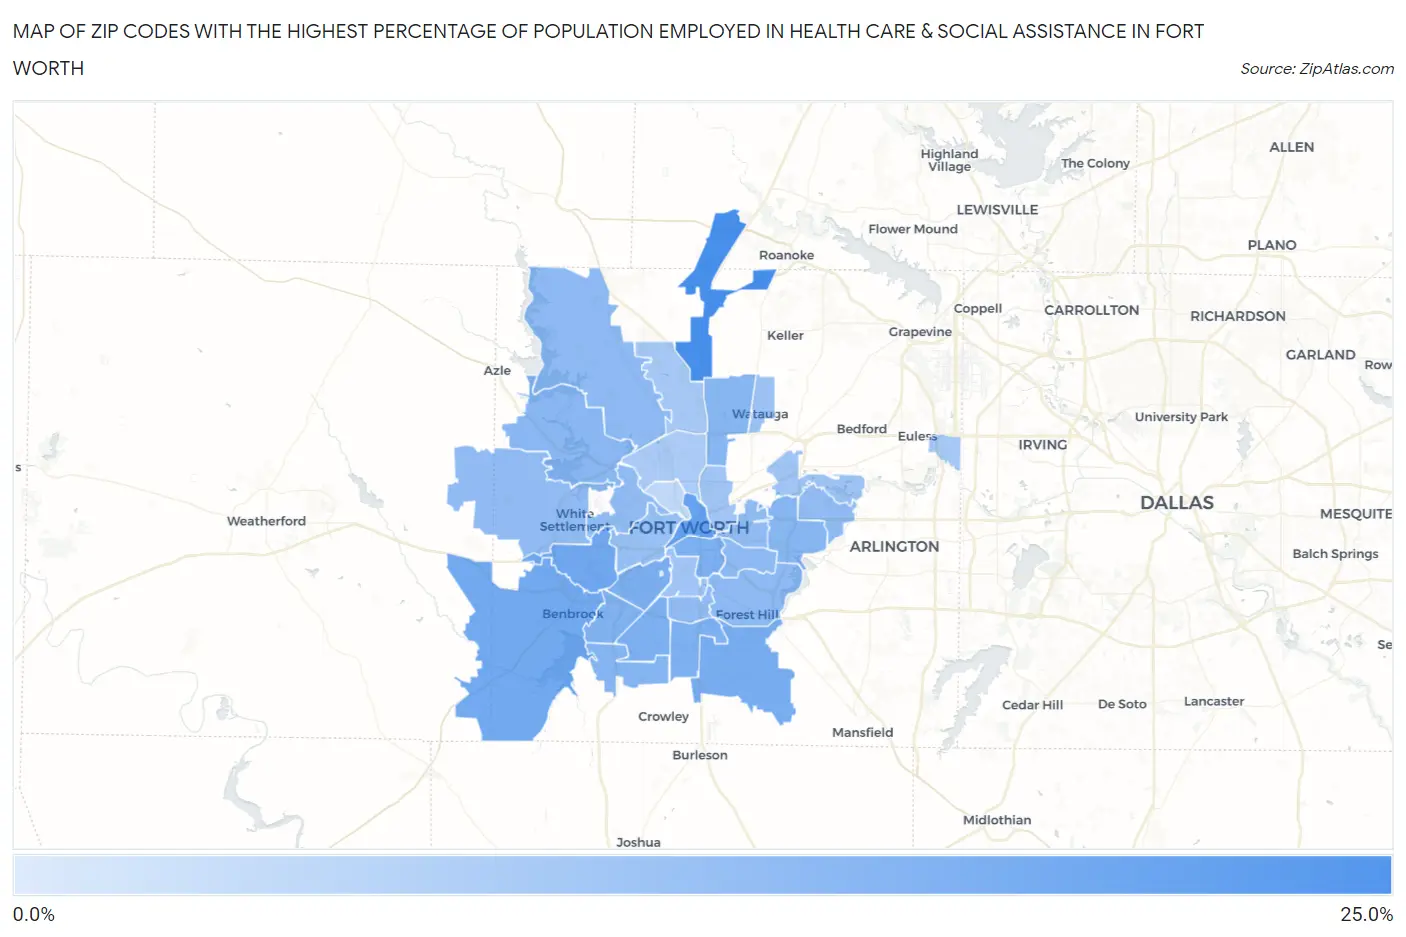
Map of Zip Codes with the Highest Percentage of Population Employed in Health Care & Social Assistance in Fort Worth
1.3%
20.4%
Zip Codes with the Highest Percentage of Population Employed in Health Care & Social Assistance in Fort Worth, TX
| Zip Code | % Employed | vs State | vs National | |
| 1. | 76177 | 20.4% | 11.9%(+8.52)#144 | 13.9%(+6.51)#3,761 |
| 2. | 76102 | 16.3% | 11.9%(+4.35)#307 | 13.9%(+2.34)#8,966 |
| 3. | 76116 | 14.7% | 11.9%(+2.78)#458 | 13.9%(+0.769)#12,342 |
| 4. | 76126 | 14.4% | 11.9%(+2.44)#497 | 13.9%(+0.429)#13,182 |
| 5. | 76140 | 13.8% | 11.9%(+1.90)#564 | 13.9%(-0.108)#14,510 |
| 6. | 76104 | 13.4% | 11.9%(+1.47)#616 | 13.9%(-0.545)#15,577 |
| 7. | 76109 | 13.2% | 11.9%(+1.31)#636 | 13.9%(-0.704)#15,979 |
| 8. | 76133 | 13.2% | 11.9%(+1.27)#640 | 13.9%(-0.736)#16,061 |
| 9. | 76134 | 13.0% | 11.9%(+1.06)#671 | 13.9%(-0.947)#16,613 |
| 10. | 76132 | 12.6% | 11.9%(+0.656)#728 | 13.9%(-1.35)#17,634 |
| 11. | 76123 | 12.2% | 11.9%(+0.291)#771 | 13.9%(-1.72)#18,546 |
| 12. | 76137 | 11.7% | 11.9%(-0.243)#856 | 13.9%(-2.25)#19,752 |
| 13. | 76112 | 11.7% | 11.9%(-0.251)#860 | 13.9%(-2.26)#19,776 |
| 14. | 76135 | 11.4% | 11.9%(-0.563)#910 | 13.9%(-2.57)#20,532 |
| 15. | 76105 | 11.0% | 11.9%(-0.902)#954 | 13.9%(-2.91)#21,298 |
| 16. | 76179 | 11.0% | 11.9%(-0.925)#960 | 13.9%(-2.94)#21,351 |
| 17. | 76119 | 10.8% | 11.9%(-1.08)#989 | 13.9%(-3.09)#21,704 |
| 18. | 76114 | 10.7% | 11.9%(-1.18)#1,002 | 13.9%(-3.19)#21,919 |
| 19. | 76120 | 10.7% | 11.9%(-1.18)#1,003 | 13.9%(-3.19)#21,925 |
| 20. | 76115 | 10.7% | 11.9%(-1.22)#1,007 | 13.9%(-3.23)#22,005 |
| 21. | 76103 | 10.6% | 11.9%(-1.28)#1,015 | 13.9%(-3.29)#22,132 |
| 22. | 76108 | 10.5% | 11.9%(-1.43)#1,046 | 13.9%(-3.44)#22,443 |
| 23. | 76107 | 9.8% | 11.9%(-2.17)#1,173 | 13.9%(-4.18)#23,900 |
| 24. | 76148 | 9.2% | 11.9%(-2.70)#1,246 | 13.9%(-4.71)#24,825 |
| 25. | 76110 | 8.7% | 11.9%(-3.26)#1,332 | 13.9%(-5.27)#25,657 |
| 26. | 76111 | 8.6% | 11.9%(-3.34)#1,340 | 13.9%(-5.35)#25,764 |
| 27. | 76118 | 8.5% | 11.9%(-3.40)#1,348 | 13.9%(-5.41)#25,858 |
| 28. | 76131 | 8.0% | 11.9%(-3.95)#1,407 | 13.9%(-5.96)#26,510 |
| 29. | 76155 | 8.0% | 11.9%(-3.97)#1,410 | 13.9%(-5.98)#26,532 |
| 30. | 76106 | 7.3% | 11.9%(-4.60)#1,480 | 13.9%(-6.61)#27,174 |
| 31. | 76164 | 5.0% | 11.9%(-6.93)#1,642 | 13.9%(-8.94)#29,085 |
| 32. | 76129 | 1.3% | 11.9%(-10.6)#1,738 | 13.9%(-12.6)#30,466 |
1
Common Questions
What are the Top 10 Zip Codes with the Highest Percentage of Population Employed in Health Care & Social Assistance in Fort Worth, TX?
Top 10 Zip Codes with the Highest Percentage of Population Employed in Health Care & Social Assistance in Fort Worth, TX are:
What zip code has the Highest Percentage of Population Employed in Health Care & Social Assistance in Fort Worth, TX?
76177 has the Highest Percentage of Population Employed in Health Care & Social Assistance in Fort Worth, TX with 20.4%.
What is the Percentage of Population Employed in Health Care & Social Assistance in Fort Worth, TX?
Percentage of Population Employed in Health Care & Social Assistance in Fort Worth is 11.5%.
What is the Percentage of Population Employed in Health Care & Social Assistance in Texas?
Percentage of Population Employed in Health Care & Social Assistance in Texas is 11.9%.
What is the Percentage of Population Employed in Health Care & Social Assistance in the United States?
Percentage of Population Employed in Health Care & Social Assistance in the United States is 13.9%.