Zip Codes with the Highest Percentage of Population with a Degree in Bio, Nature & Agricultural in Pittsburgh, PA
RELATED REPORTS & OPTIONS
Bio, Nature & Agricultural
Pittsburgh
Compare Zip Codes
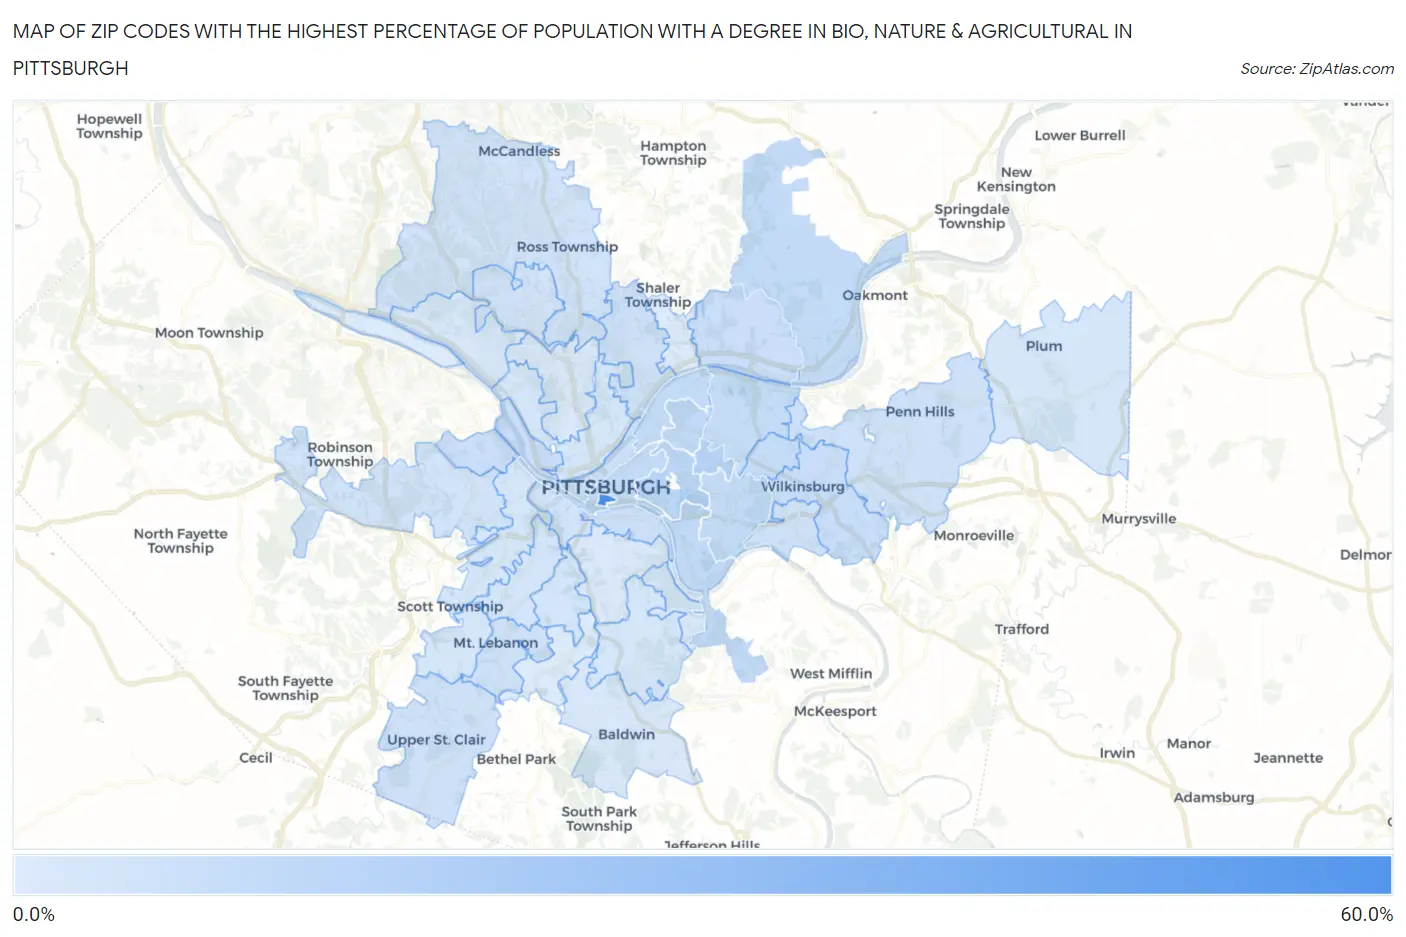
Map of Zip Codes with the Highest Percentage of Population with a Degree in Bio, Nature & Agricultural in Pittsburgh
1.6%
54.9%
Zip Codes with the Highest Percentage of Population with a Degree in Bio, Nature & Agricultural in Pittsburgh, PA
| Zip Code | % Graduates | vs State | vs National | |
| 1. | 15282 | 54.9% | 6.5%(+48.4)#11 | 6.4%(+48.5)#271 |
| 2. | 15232 | 13.5% | 6.5%(+7.01)#167 | 6.4%(+7.14)#5,083 |
| 3. | 15213 | 11.9% | 6.5%(+5.40)#208 | 6.4%(+5.53)#6,256 |
| 4. | 15207 | 10.0% | 6.5%(+3.53)#297 | 6.4%(+3.66)#8,102 |
| 5. | 15224 | 9.8% | 6.5%(+3.33)#308 | 6.4%(+3.45)#8,375 |
| 6. | 15201 | 9.2% | 6.5%(+2.76)#351 | 6.4%(+2.89)#9,146 |
| 7. | 15219 | 9.1% | 6.5%(+2.66)#361 | 6.4%(+2.79)#9,289 |
| 8. | 15217 | 8.9% | 6.5%(+2.41)#387 | 6.4%(+2.53)#9,734 |
| 9. | 15238 | 8.8% | 6.5%(+2.33)#397 | 6.4%(+2.46)#9,840 |
| 10. | 15206 | 8.7% | 6.5%(+2.17)#411 | 6.4%(+2.30)#10,085 |
| 11. | 15208 | 8.1% | 6.5%(+1.64)#461 | 6.4%(+1.77)#10,975 |
| 12. | 15221 | 7.5% | 6.5%(+0.993)#523 | 6.4%(+1.12)#12,235 |
| 13. | 15233 | 7.3% | 6.5%(+0.799)#558 | 6.4%(+0.926)#12,698 |
| 14. | 15215 | 7.1% | 6.5%(+0.637)#570 | 6.4%(+0.765)#13,052 |
| 15. | 15204 | 7.1% | 6.5%(+0.597)#574 | 6.4%(+0.724)#13,143 |
| 16. | 15222 | 6.7% | 6.5%(+0.215)#628 | 6.4%(+0.342)#14,096 |
| 17. | 15203 | 6.2% | 6.5%(-0.314)#721 | 6.4%(-0.187)#15,467 |
| 18. | 15209 | 6.0% | 6.5%(-0.508)#746 | 6.4%(-0.381)#15,991 |
| 19. | 15218 | 5.9% | 6.5%(-0.583)#757 | 6.4%(-0.456)#16,215 |
| 20. | 15228 | 5.8% | 6.5%(-0.672)#772 | 6.4%(-0.545)#16,476 |
| 21. | 15241 | 5.5% | 6.5%(-0.936)#812 | 6.4%(-0.809)#17,196 |
| 22. | 15235 | 5.5% | 6.5%(-0.945)#818 | 6.4%(-0.818)#17,231 |
| 23. | 15237 | 5.3% | 6.5%(-1.19)#847 | 6.4%(-1.07)#17,941 |
| 24. | 15205 | 5.1% | 6.5%(-1.36)#873 | 6.4%(-1.23)#18,428 |
| 25. | 15229 | 5.1% | 6.5%(-1.40)#881 | 6.4%(-1.27)#18,562 |
| 26. | 15211 | 5.0% | 6.5%(-1.44)#890 | 6.4%(-1.32)#18,682 |
| 27. | 15216 | 4.5% | 6.5%(-1.96)#967 | 6.4%(-1.83)#20,215 |
| 28. | 15226 | 4.4% | 6.5%(-2.05)#983 | 6.4%(-1.92)#20,459 |
| 29. | 15220 | 3.7% | 6.5%(-2.73)#1,075 | 6.4%(-2.61)#22,279 |
| 30. | 15227 | 3.7% | 6.5%(-2.75)#1,077 | 6.4%(-2.62)#22,295 |
| 31. | 15243 | 3.7% | 6.5%(-2.80)#1,083 | 6.4%(-2.67)#22,414 |
| 32. | 15212 | 3.5% | 6.5%(-3.01)#1,106 | 6.4%(-2.89)#22,888 |
| 33. | 15239 | 3.3% | 6.5%(-3.15)#1,125 | 6.4%(-3.02)#23,173 |
| 34. | 15236 | 3.3% | 6.5%(-3.19)#1,130 | 6.4%(-3.06)#23,276 |
| 35. | 15202 | 3.2% | 6.5%(-3.26)#1,137 | 6.4%(-3.13)#23,439 |
| 36. | 15210 | 2.3% | 6.5%(-4.14)#1,220 | 6.4%(-4.01)#24,933 |
| 37. | 15214 | 2.1% | 6.5%(-4.42)#1,252 | 6.4%(-4.30)#25,283 |
| 38. | 15223 | 2.0% | 6.5%(-4.52)#1,261 | 6.4%(-4.40)#25,398 |
| 39. | 15234 | 1.8% | 6.5%(-4.64)#1,268 | 6.4%(-4.51)#25,522 |
| 40. | 15225 | 1.6% | 6.5%(-4.84)#1,289 | 6.4%(-4.71)#25,719 |
1
Common Questions
What are the Top 10 Zip Codes with the Highest Percentage of Population with a Degree in Bio, Nature & Agricultural in Pittsburgh, PA?
Top 10 Zip Codes with the Highest Percentage of Population with a Degree in Bio, Nature & Agricultural in Pittsburgh, PA are:
What zip code has the Highest Percentage of Population with a Degree in Bio, Nature & Agricultural in Pittsburgh, PA?
15282 has the Highest Percentage of Population with a Degree in Bio, Nature & Agricultural in Pittsburgh, PA with 54.9%.
What is the Percentage of Population with a Degree in Bio, Nature & Agricultural in Pittsburgh, PA?
Percentage of Population with a Degree in Bio, Nature & Agricultural in Pittsburgh is 7.7%.
What is the Percentage of Population with a Degree in Bio, Nature & Agricultural in Pennsylvania?
Percentage of Population with a Degree in Bio, Nature & Agricultural in Pennsylvania is 6.5%.
What is the Percentage of Population with a Degree in Bio, Nature & Agricultural in the United States?
Percentage of Population with a Degree in Bio, Nature & Agricultural in the United States is 6.4%.