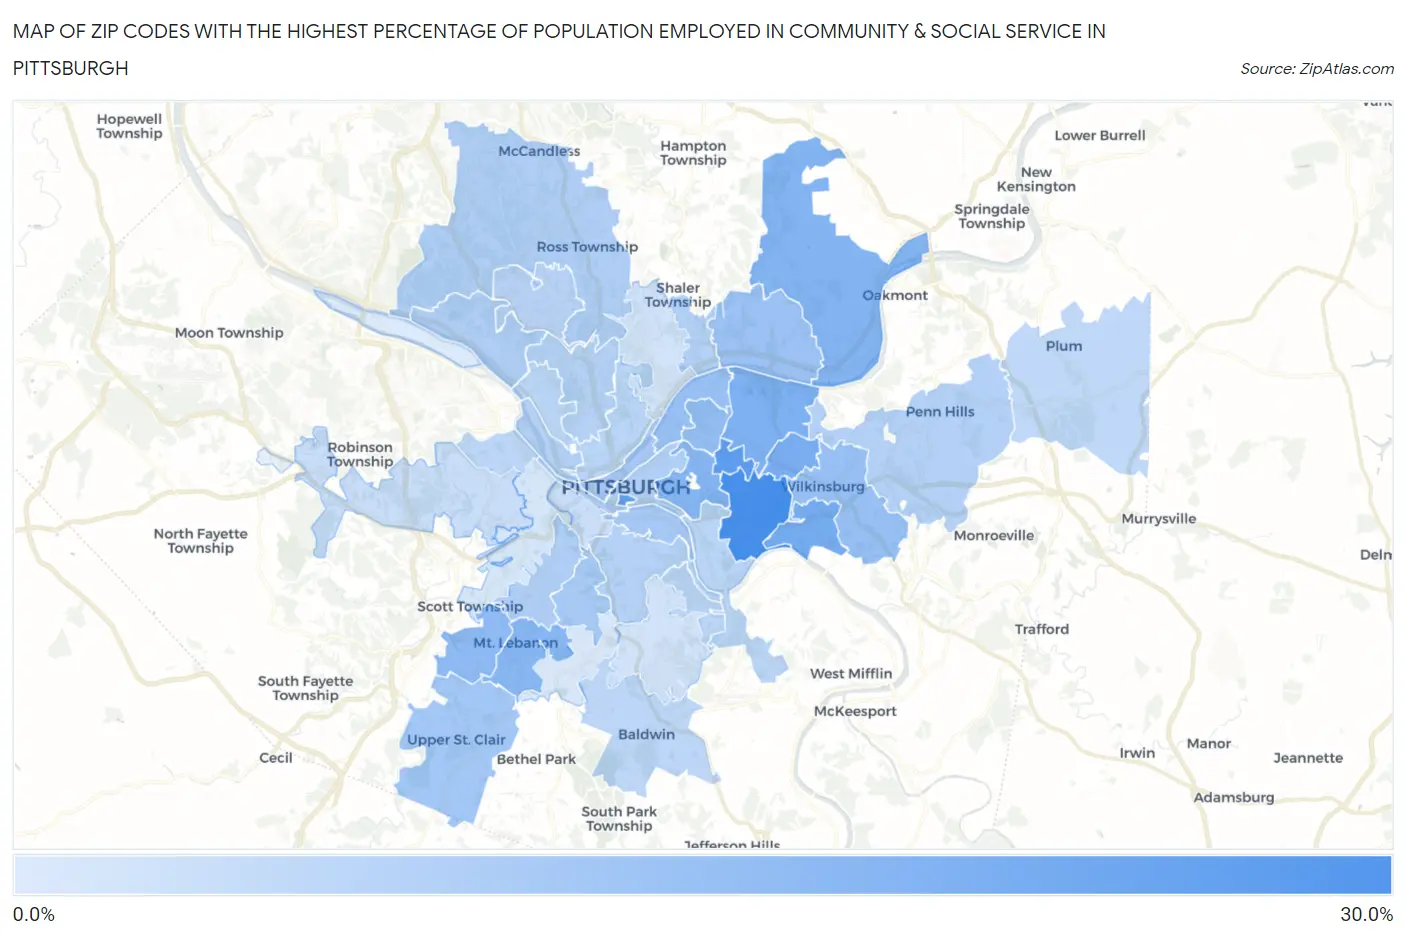
Zip Codes with the Highest Percentage of Population Employed in Community & Social Service in Pittsburgh, PA
RELATED REPORTS & OPTIONS
Community & Social Service
Pittsburgh
Compare Zip Codes
Map of Zip Codes with the Highest Percentage of Population Employed in Community & Social Service in Pittsburgh
7.2%
27.1%
Zip Codes with the Highest Percentage of Population Employed in Community & Social Service in Pittsburgh, PA
| Zip Code | % Employed | vs State | vs National | |
| 1. | 15217 | 27.1% | 11.2%(+15.9)#37 | 11.2%(+15.9)#762 |
| 2. | 15232 | 23.8% | 11.2%(+12.6)#53 | 11.2%(+12.6)#1,135 |
| 3. | 15282 | 23.0% | 11.2%(+11.9)#55 | 11.2%(+11.8)#1,270 |
| 4. | 15218 | 20.6% | 11.2%(+9.46)#77 | 11.2%(+9.42)#1,829 |
| 5. | 15208 | 20.0% | 11.2%(+8.85)#83 | 11.2%(+8.82)#2,003 |
| 6. | 15206 | 19.4% | 11.2%(+8.22)#90 | 11.2%(+8.18)#2,237 |
| 7. | 15238 | 18.6% | 11.2%(+7.40)#108 | 11.2%(+7.36)#2,563 |
| 8. | 15213 | 18.5% | 11.2%(+7.32)#114 | 11.2%(+7.28)#2,596 |
| 9. | 15228 | 18.3% | 11.2%(+7.08)#119 | 11.2%(+7.04)#2,695 |
| 10. | 15243 | 17.3% | 11.2%(+6.12)#139 | 11.2%(+6.08)#3,188 |
| 11. | 15224 | 16.4% | 11.2%(+5.27)#155 | 11.2%(+5.23)#3,738 |
| 12. | 15221 | 16.0% | 11.2%(+4.80)#170 | 11.2%(+4.76)#4,080 |
| 13. | 15201 | 15.9% | 11.2%(+4.69)#176 | 11.2%(+4.66)#4,174 |
| 14. | 15215 | 15.3% | 11.2%(+4.15)#199 | 11.2%(+4.11)#4,682 |
| 15. | 15241 | 14.5% | 11.2%(+3.28)#227 | 11.2%(+3.24)#5,524 |
| 16. | 15203 | 14.3% | 11.2%(+3.09)#238 | 11.2%(+3.05)#5,758 |
| 17. | 15222 | 14.0% | 11.2%(+2.87)#251 | 11.2%(+2.83)#6,035 |
| 18. | 15226 | 13.8% | 11.2%(+2.59)#268 | 11.2%(+2.55)#6,388 |
| 19. | 15216 | 13.0% | 11.2%(+1.85)#306 | 11.2%(+1.81)#7,516 |
| 20. | 15202 | 13.0% | 11.2%(+1.82)#310 | 11.2%(+1.79)#7,555 |
| 21. | 15237 | 12.8% | 11.2%(+1.64)#320 | 11.2%(+1.60)#7,864 |
| 22. | 15219 | 12.8% | 11.2%(+1.60)#324 | 11.2%(+1.56)#7,934 |
| 23. | 15235 | 12.4% | 11.2%(+1.17)#364 | 11.2%(+1.14)#8,693 |
| 24. | 15233 | 12.3% | 11.2%(+1.13)#368 | 11.2%(+1.09)#8,763 |
| 25. | 15223 | 12.3% | 11.2%(+1.12)#370 | 11.2%(+1.08)#8,779 |
| 26. | 15210 | 12.1% | 11.2%(+0.884)#395 | 11.2%(+0.846)#9,246 |
| 27. | 15214 | 11.9% | 11.2%(+0.767)#404 | 11.2%(+0.729)#9,500 |
| 28. | 15229 | 11.7% | 11.2%(+0.486)#438 | 11.2%(+0.447)#10,094 |
| 29. | 15212 | 11.6% | 11.2%(+0.415)#448 | 11.2%(+0.377)#10,250 |
| 30. | 15207 | 11.4% | 11.2%(+0.236)#464 | 11.2%(+0.198)#10,641 |
| 31. | 15236 | 11.2% | 11.2%(+0.044)#490 | 11.2%(+0.006)#11,079 |
| 32. | 15204 | 11.1% | 11.2%(-0.110)#513 | 11.2%(-0.148)#11,472 |
| 33. | 15239 | 10.9% | 11.2%(-0.252)#533 | 11.2%(-0.290)#11,838 |
| 34. | 15205 | 9.8% | 11.2%(-1.38)#673 | 11.2%(-1.41)#14,644 |
| 35. | 15211 | 9.4% | 11.2%(-1.79)#735 | 11.2%(-1.83)#15,730 |
| 36. | 15227 | 8.7% | 11.2%(-2.43)#833 | 11.2%(-2.47)#17,514 |
| 37. | 15209 | 8.6% | 11.2%(-2.56)#848 | 11.2%(-2.60)#17,841 |
| 38. | 15220 | 8.1% | 11.2%(-3.11)#924 | 11.2%(-3.15)#19,392 |
| 39. | 15234 | 7.8% | 11.2%(-3.36)#972 | 11.2%(-3.40)#20,114 |
| 40. | 15225 | 7.2% | 11.2%(-3.98)#1,067 | 11.2%(-4.01)#21,652 |
1
Common Questions
What are the Top 10 Zip Codes with the Highest Percentage of Population Employed in Community & Social Service in Pittsburgh, PA?
Top 10 Zip Codes with the Highest Percentage of Population Employed in Community & Social Service in Pittsburgh, PA are:
What zip code has the Highest Percentage of Population Employed in Community & Social Service in Pittsburgh, PA?
15217 has the Highest Percentage of Population Employed in Community & Social Service in Pittsburgh, PA with 27.1%.
What is the Percentage of Population Employed in Community & Social Service in Pittsburgh, PA?
Percentage of Population Employed in Community & Social Service in Pittsburgh is 16.0%.
What is the Percentage of Population Employed in Community & Social Service in Pennsylvania?
Percentage of Population Employed in Community & Social Service in Pennsylvania is 11.2%.
What is the Percentage of Population Employed in Community & Social Service in the United States?
Percentage of Population Employed in Community & Social Service in the United States is 11.2%.