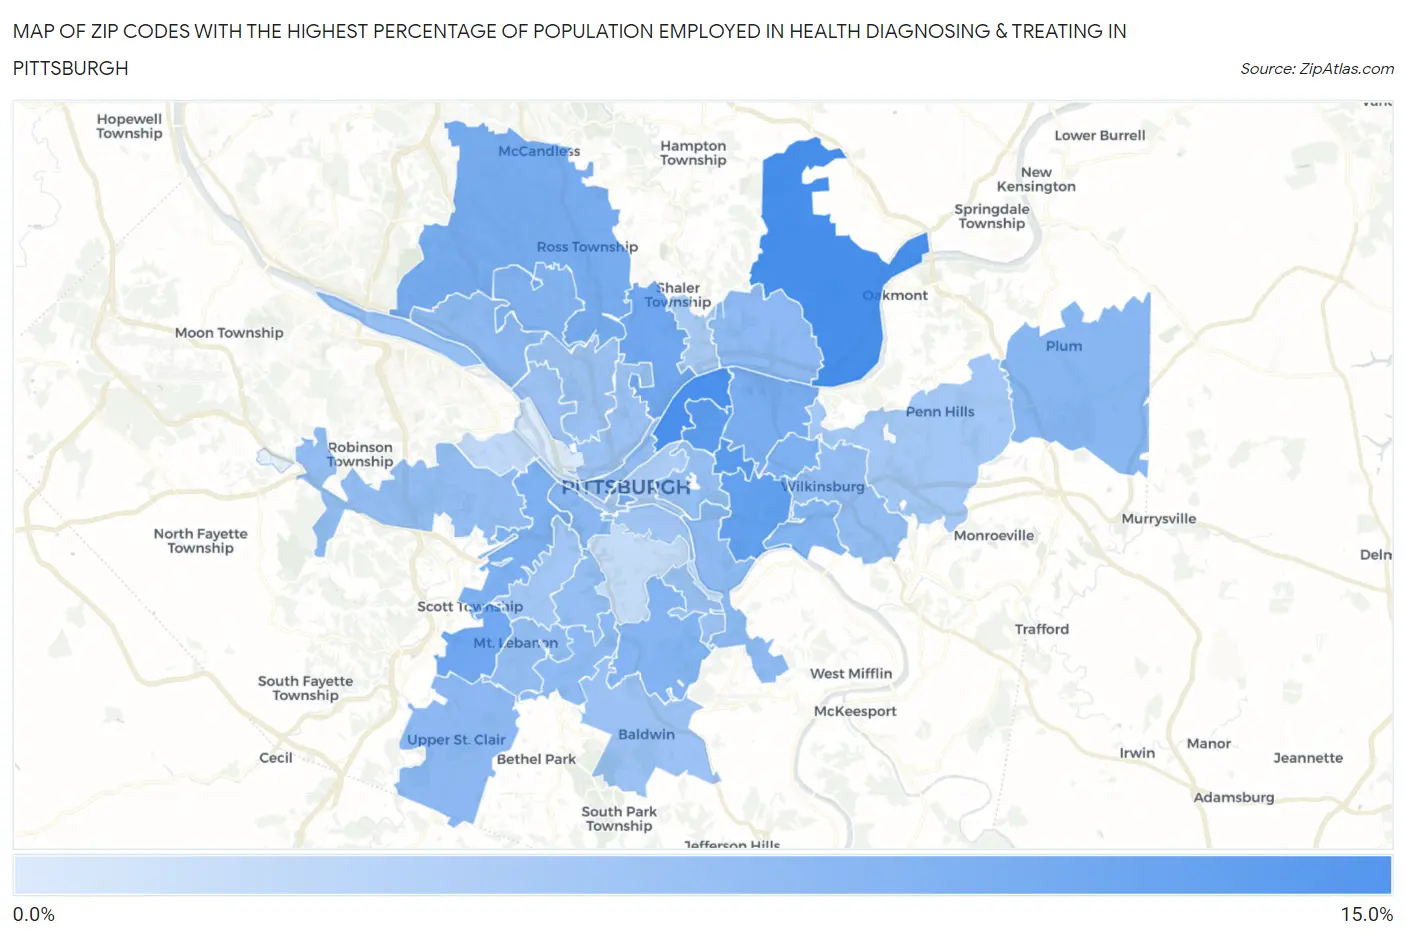
Zip Codes with the Highest Percentage of Population Employed in Health Diagnosing & Treating in Pittsburgh, PA
RELATED REPORTS & OPTIONS
Health Diagnosing & Treating
Pittsburgh
Compare Zip Codes
Map of Zip Codes with the Highest Percentage of Population Employed in Health Diagnosing & Treating in Pittsburgh
1.8%
14.3%

Zip Codes with the Highest Percentage of Population Employed in Health Diagnosing & Treating in Pittsburgh, PA
| Zip Code | % Employed | vs State | vs National | |
| 1. | 15238 | 14.3% | 7.4%(+6.90)#93 | 6.2%(+8.01)#1,340 |
| 2. | 15201 | 14.0% | 7.4%(+6.66)#98 | 6.2%(+7.76)#1,410 |
| 3. | 15232 | 12.8% | 7.4%(+5.47)#126 | 6.2%(+6.57)#1,822 |
| 4. | 15224 | 12.4% | 7.4%(+5.09)#138 | 6.2%(+6.20)#1,983 |
| 5. | 15217 | 11.9% | 7.4%(+4.56)#162 | 6.2%(+5.66)#2,276 |
| 6. | 15243 | 10.7% | 7.4%(+3.35)#235 | 6.2%(+4.45)#3,140 |
| 7. | 15209 | 10.6% | 7.4%(+3.21)#243 | 6.2%(+4.32)#3,257 |
| 8. | 15237 | 10.0% | 7.4%(+2.69)#290 | 6.2%(+3.80)#3,833 |
| 9. | 15206 | 9.9% | 7.4%(+2.56)#303 | 6.2%(+3.67)#3,989 |
| 10. | 15282 | 9.6% | 7.4%(+2.29)#327 | 6.2%(+3.40)#4,336 |
| 11. | 15220 | 9.5% | 7.4%(+2.16)#333 | 6.2%(+3.27)#4,517 |
| 12. | 15208 | 9.4% | 7.4%(+2.06)#346 | 6.2%(+3.16)#4,675 |
| 13. | 15229 | 9.1% | 7.4%(+1.75)#376 | 6.2%(+2.86)#5,177 |
| 14. | 15218 | 9.0% | 7.4%(+1.67)#388 | 6.2%(+2.77)#5,351 |
| 15. | 15227 | 9.0% | 7.4%(+1.65)#392 | 6.2%(+2.75)#5,384 |
| 16. | 15239 | 8.8% | 7.4%(+1.44)#423 | 6.2%(+2.55)#5,746 |
| 17. | 15211 | 8.5% | 7.4%(+1.11)#477 | 6.2%(+2.22)#6,417 |
| 18. | 15241 | 8.3% | 7.4%(+0.937)#502 | 6.2%(+2.04)#6,803 |
| 19. | 15215 | 8.2% | 7.4%(+0.845)#512 | 6.2%(+1.95)#7,019 |
| 20. | 15234 | 8.2% | 7.4%(+0.806)#519 | 6.2%(+1.91)#7,112 |
| 21. | 15207 | 8.1% | 7.4%(+0.775)#525 | 6.2%(+1.88)#7,188 |
| 22. | 15202 | 8.0% | 7.4%(+0.695)#546 | 6.2%(+1.80)#7,377 |
| 23. | 15221 | 7.8% | 7.4%(+0.448)#588 | 6.2%(+1.55)#7,999 |
| 24. | 15222 | 7.8% | 7.4%(+0.430)#592 | 6.2%(+1.54)#8,048 |
| 25. | 15205 | 7.7% | 7.4%(+0.377)#598 | 6.2%(+1.48)#8,181 |
| 26. | 15228 | 7.7% | 7.4%(+0.312)#607 | 6.2%(+1.42)#8,338 |
| 27. | 15213 | 7.6% | 7.4%(+0.272)#613 | 6.2%(+1.38)#8,447 |
| 28. | 15225 | 7.6% | 7.4%(+0.249)#621 | 6.2%(+1.36)#8,519 |
| 29. | 15226 | 7.5% | 7.4%(+0.194)#628 | 6.2%(+1.30)#8,675 |
| 30. | 15236 | 7.1% | 7.4%(-0.210)#706 | 6.2%(+0.896)#9,917 |
| 31. | 15214 | 7.0% | 7.4%(-0.307)#719 | 6.2%(+0.799)#10,217 |
| 32. | 15212 | 7.0% | 7.4%(-0.373)#736 | 6.2%(+0.733)#10,425 |
| 33. | 15203 | 6.6% | 7.4%(-0.785)#835 | 6.2%(+0.321)#11,804 |
| 34. | 15235 | 6.5% | 7.4%(-0.891)#855 | 6.2%(+0.215)#12,170 |
| 35. | 15216 | 6.3% | 7.4%(-1.02)#889 | 6.2%(+0.085)#12,661 |
| 36. | 15223 | 6.1% | 7.4%(-1.23)#936 | 6.2%(-0.125)#13,462 |
| 37. | 15219 | 5.9% | 7.4%(-1.49)#985 | 6.2%(-0.382)#14,373 |
| 38. | 15204 | 4.2% | 7.4%(-3.18)#1,297 | 6.2%(-2.07)#20,804 |
| 39. | 15210 | 3.6% | 7.4%(-3.71)#1,354 | 6.2%(-2.61)#22,498 |
| 40. | 15233 | 1.8% | 7.4%(-5.56)#1,513 | 6.2%(-4.45)#26,810 |
1
Common Questions
What are the Top 10 Zip Codes with the Highest Percentage of Population Employed in Health Diagnosing & Treating in Pittsburgh, PA?
Top 10 Zip Codes with the Highest Percentage of Population Employed in Health Diagnosing & Treating in Pittsburgh, PA are:
What zip code has the Highest Percentage of Population Employed in Health Diagnosing & Treating in Pittsburgh, PA?
15238 has the Highest Percentage of Population Employed in Health Diagnosing & Treating in Pittsburgh, PA with 14.3%.
What is the Percentage of Population Employed in Health Diagnosing & Treating in Pittsburgh, PA?
Percentage of Population Employed in Health Diagnosing & Treating in Pittsburgh is 8.4%.
What is the Percentage of Population Employed in Health Diagnosing & Treating in Pennsylvania?
Percentage of Population Employed in Health Diagnosing & Treating in Pennsylvania is 7.4%.
What is the Percentage of Population Employed in Health Diagnosing & Treating in the United States?
Percentage of Population Employed in Health Diagnosing & Treating in the United States is 6.2%.