Zip Codes with the Highest Percentage of Population Employed in Accommodation & Food Services in Pittsburgh, PA
RELATED REPORTS & OPTIONS
Accommodation & Food Services
Pittsburgh
Compare Zip Codes
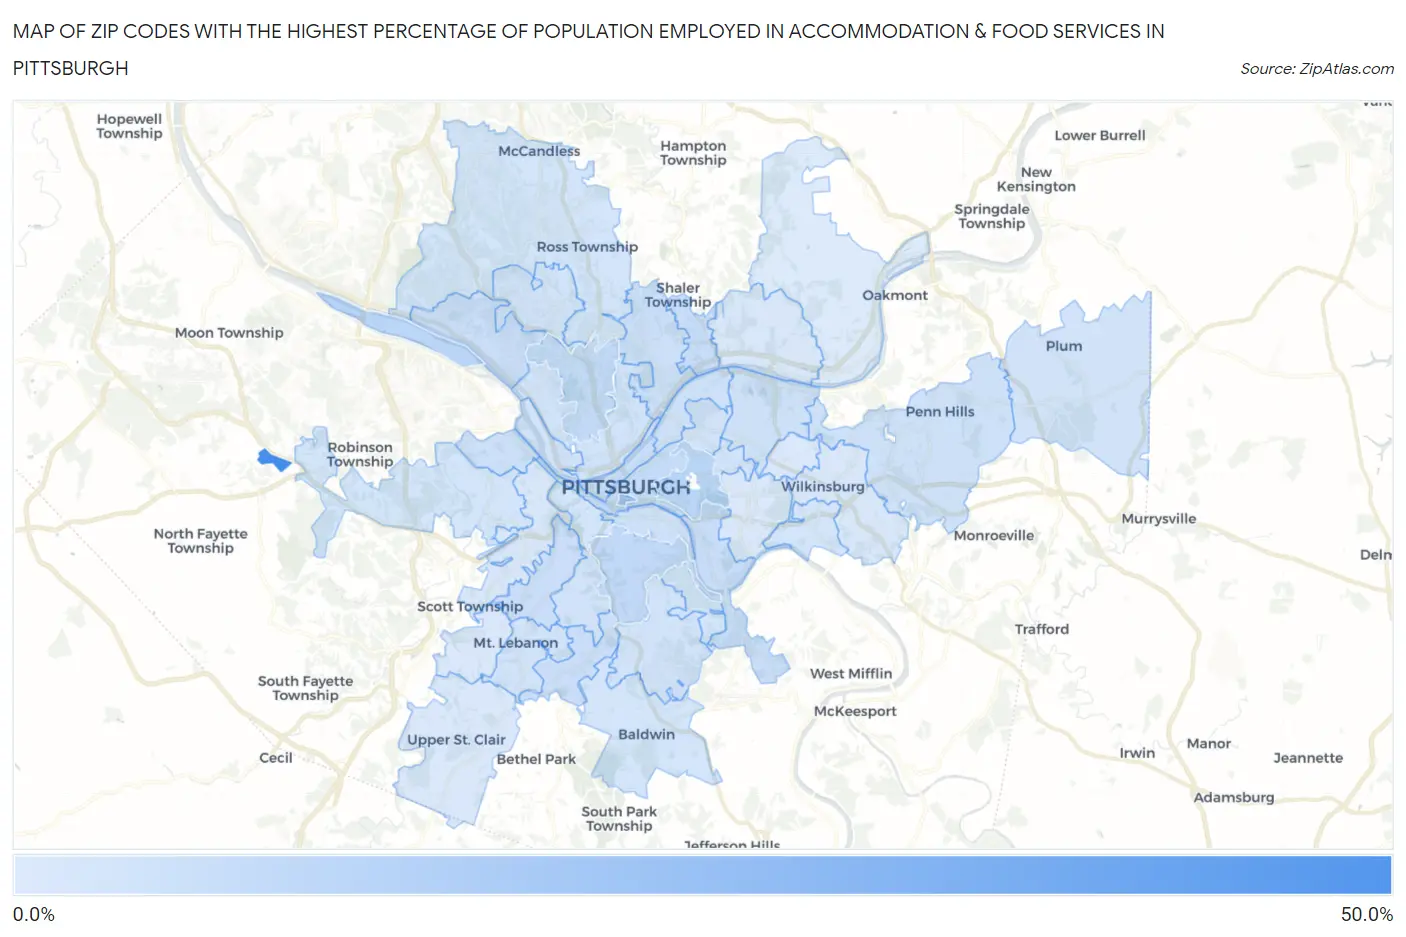
Map of Zip Codes with the Highest Percentage of Population Employed in Accommodation & Food Services in Pittsburgh
3.0%
50.0%
Zip Codes with the Highest Percentage of Population Employed in Accommodation & Food Services in Pittsburgh, PA
| Zip Code | % Employed | vs State | vs National | |
| 1. | 15275 | 50.0% | 5.9%(+44.1)#4 | 6.9%(+43.1)#102 |
| 2. | 15282 | 20.4% | 5.9%(+14.5)#52 | 6.9%(+13.6)#789 |
| 3. | 15213 | 12.5% | 5.9%(+6.58)#134 | 6.9%(+5.59)#2,605 |
| 4. | 15225 | 12.0% | 5.9%(+6.11)#140 | 6.9%(+5.12)#2,826 |
| 5. | 15210 | 10.6% | 5.9%(+4.72)#187 | 6.9%(+3.73)#3,871 |
| 6. | 15214 | 9.6% | 5.9%(+3.73)#226 | 6.9%(+2.73)#5,043 |
| 7. | 15219 | 9.3% | 5.9%(+3.41)#238 | 6.9%(+2.41)#5,509 |
| 8. | 15222 | 8.6% | 5.9%(+2.71)#282 | 6.9%(+1.71)#6,654 |
| 9. | 15207 | 8.5% | 5.9%(+2.57)#292 | 6.9%(+1.58)#6,892 |
| 10. | 15223 | 8.3% | 5.9%(+2.43)#310 | 6.9%(+1.44)#7,178 |
| 11. | 15202 | 8.1% | 5.9%(+2.25)#325 | 6.9%(+1.26)#7,557 |
| 12. | 15234 | 8.1% | 5.9%(+2.19)#332 | 6.9%(+1.20)#7,654 |
| 13. | 15216 | 7.9% | 5.9%(+2.04)#355 | 6.9%(+1.05)#7,977 |
| 14. | 15209 | 7.2% | 5.9%(+1.26)#448 | 6.9%(+0.270)#9,917 |
| 15. | 15204 | 7.1% | 5.9%(+1.26)#451 | 6.9%(+0.267)#9,923 |
| 16. | 15235 | 6.7% | 5.9%(+0.832)#511 | 6.9%(-0.160)#11,141 |
| 17. | 15203 | 6.4% | 5.9%(+0.509)#575 | 6.9%(-0.483)#12,168 |
| 18. | 15201 | 6.4% | 5.9%(+0.466)#583 | 6.9%(-0.526)#12,311 |
| 19. | 15206 | 6.4% | 5.9%(+0.464)#584 | 6.9%(-0.527)#12,316 |
| 20. | 15233 | 6.2% | 5.9%(+0.357)#603 | 6.9%(-0.635)#12,655 |
| 21. | 15224 | 6.1% | 5.9%(+0.202)#627 | 6.9%(-0.790)#13,166 |
| 22. | 15226 | 6.1% | 5.9%(+0.176)#643 | 6.9%(-0.816)#13,251 |
| 23. | 15228 | 5.9% | 5.9%(-0.035)#682 | 6.9%(-1.03)#13,938 |
| 24. | 15212 | 5.8% | 5.9%(-0.077)#690 | 6.9%(-1.07)#14,049 |
| 25. | 15239 | 5.8% | 5.9%(-0.116)#700 | 6.9%(-1.11)#14,149 |
| 26. | 15227 | 5.8% | 5.9%(-0.130)#707 | 6.9%(-1.12)#14,198 |
| 27. | 15229 | 5.7% | 5.9%(-0.160)#711 | 6.9%(-1.15)#14,280 |
| 28. | 15232 | 5.7% | 5.9%(-0.172)#714 | 6.9%(-1.16)#14,324 |
| 29. | 15237 | 5.7% | 5.9%(-0.210)#719 | 6.9%(-1.20)#14,466 |
| 30. | 15236 | 5.5% | 5.9%(-0.348)#745 | 6.9%(-1.34)#14,922 |
| 31. | 15218 | 5.5% | 5.9%(-0.405)#758 | 6.9%(-1.40)#15,098 |
| 32. | 15211 | 5.4% | 5.9%(-0.457)#770 | 6.9%(-1.45)#15,285 |
| 33. | 15205 | 5.4% | 5.9%(-0.518)#785 | 6.9%(-1.51)#15,505 |
| 34. | 15215 | 4.5% | 5.9%(-1.43)#985 | 6.9%(-2.42)#18,642 |
| 35. | 15220 | 4.2% | 5.9%(-1.66)#1,037 | 6.9%(-2.66)#19,427 |
| 36. | 15221 | 4.0% | 5.9%(-1.91)#1,095 | 6.9%(-2.90)#20,230 |
| 37. | 15208 | 3.8% | 5.9%(-2.05)#1,127 | 6.9%(-3.05)#20,678 |
| 38. | 15241 | 3.4% | 5.9%(-2.45)#1,219 | 6.9%(-3.44)#21,965 |
| 39. | 15217 | 3.4% | 5.9%(-2.54)#1,231 | 6.9%(-3.53)#22,232 |
| 40. | 15243 | 3.3% | 5.9%(-2.58)#1,237 | 6.9%(-3.57)#22,370 |
| 41. | 15238 | 3.0% | 5.9%(-2.93)#1,297 | 6.9%(-3.92)#23,310 |
1
Common Questions
What are the Top 10 Zip Codes with the Highest Percentage of Population Employed in Accommodation & Food Services in Pittsburgh, PA?
Top 10 Zip Codes with the Highest Percentage of Population Employed in Accommodation & Food Services in Pittsburgh, PA are:
What zip code has the Highest Percentage of Population Employed in Accommodation & Food Services in Pittsburgh, PA?
15275 has the Highest Percentage of Population Employed in Accommodation & Food Services in Pittsburgh, PA with 50.0%.
What is the Percentage of Population Employed in Accommodation & Food Services in Pittsburgh, PA?
Percentage of Population Employed in Accommodation & Food Services in Pittsburgh is 7.1%.
What is the Percentage of Population Employed in Accommodation & Food Services in Pennsylvania?
Percentage of Population Employed in Accommodation & Food Services in Pennsylvania is 5.9%.
What is the Percentage of Population Employed in Accommodation & Food Services in the United States?
Percentage of Population Employed in Accommodation & Food Services in the United States is 6.9%.