Zip Codes with the Highest Percentage of Population with a Degree in Business in Pittsburgh, PA

RELATED REPORTS & OPTIONS

Business
Population
Families and Households
Female Fertility
Female Fertility (Unmarried)
Race (Community Size)
Race (Percentage)
Ancestry (Community Size)
AfghanAfricanAlbanianAlsatianAmericanApacheArabArgentineanArmenianAustralianAustrianBahamianBarbadianBasqueBelgianBhutaneseBlackfeetBolivianBrazilianBritishBritish West IndianBulgarianBurmeseCajunCambodianCanadianCape VerdeanCarpatho RusynCelticCentral AmericanCentral American IndianCherokeeChickasawChileanChippewaChoctawColombianComancheCosta RicanCreekCroatianCubanCypriotCzechCzechoslovakianDanishDelawareDominicanDutchEastern EuropeanEcuadorianEgyptianEnglishEthiopianEuropeanFilipinoFinnishFrenchFrench American IndianFrench CanadianGermanGhanaianGreekGuamanian / ChamorroGuatemalanGuyaneseHaitianHonduranHungarianIndian (Asian)IndonesianIranianIraqiIrishIroquoisIsraeliItalianJamaicanJapaneseJordanianKenyanKoreanLaotianLatvianLebaneseLiberianLithuanianLumbeeLuxembourgerMacedonianMalaysianMalteseMexicanMexican American IndianMongolianMoroccanNative HawaiianNavajoNew ZealanderNicaraguanNigerianNorthern EuropeanNorwegianPakistaniPalestinianPanamanianParaguayanPennsylvania GermanPeruvianPolishPortuguesePuerto RicanRomanianRussianSalvadoranSamoanScandinavianScotch-IrishScottishSeminoleSerbianSiouxSlavicSlovakSloveneSouth AfricanSouth AmericanSouth American IndianSoviet UnionSpaniardSpanishSri LankanSubsaharan AfricanSudaneseSwedishSwissSyrianThaiTrinidadian and TobagonianTurkishU.S. Virgin IslanderUgandanUkrainianUruguayanVenezuelanVietnameseWelshWest IndianYugoslavian
Ancestry (Percentage)
AfghanAfricanAlbanianAlsatianAmericanApacheArabArgentineanArmenianAustralianAustrianBahamianBarbadianBasqueBelgianBhutaneseBlackfeetBolivianBrazilianBritishBritish West IndianBulgarianBurmeseCajunCambodianCanadianCape VerdeanCarpatho RusynCelticCentral AmericanCentral American IndianCherokeeChickasawChileanChippewaChoctawColombianComancheCosta RicanCreekCroatianCubanCypriotCzechCzechoslovakianDanishDelawareDominicanDutchEastern EuropeanEcuadorianEgyptianEnglishEthiopianEuropeanFilipinoFinnishFrenchFrench American IndianFrench CanadianGermanGhanaianGreekGuamanian / ChamorroGuatemalanGuyaneseHaitianHonduranHungarianIndian (Asian)IndonesianIranianIraqiIrishIroquoisIsraeliItalianJamaicanJapaneseJordanianKenyanKoreanLaotianLatvianLebaneseLiberianLithuanianLumbeeLuxembourgerMacedonianMalaysianMalteseMexicanMexican American IndianMongolianMoroccanNative HawaiianNavajoNew ZealanderNicaraguanNigerianNorthern EuropeanNorwegianPakistaniPalestinianPanamanianParaguayanPennsylvania GermanPeruvianPolishPortuguesePuerto RicanRomanianRussianSalvadoranSamoanScandinavianScotch-IrishScottishSeminoleSerbianSiouxSlavicSlovakSloveneSouth AfricanSouth AmericanSouth American IndianSoviet UnionSpaniardSpanishSri LankanSubsaharan AfricanSudaneseSwedishSwissSyrianThaiTrinidadian and TobagonianTurkishU.S. Virgin IslanderUgandanUkrainianUruguayanVenezuelanVietnameseWelshWest IndianYugoslavian
Immigrant Origin (Total)
AfghanistanAfricaAlbaniaArgentinaAsiaAustraliaAustriaBahamasBangladeshBelarusBelgiumBoliviaBosnia and HerzegovinaBrazilBulgariaBurma / MyanmarCambodiaCameroonCanadaCaribbeanCentral AmericaChileChinaColombiaCongoCosta RicaCroatiaCubaCzechoslovakiaDenmarkDominican RepublicEastern AfricaEastern AsiaEastern EuropeEcuadorEgyptEl SalvadorEnglandEritreaEthiopiaEuropeFranceGermanyGhanaGreeceGuatemalaGuyanaHaitiHondurasHong KongHungaryIndiaIndonesiaIranIraqIrelandIsraelItalyJamaicaJapanJordanKazakhstanKenyaKoreaKuwaitLatin AmericaLatviaLebanonLiberiaLithuaniaMalaysiaMexicoMiddle AfricaMoldovaMoroccoNepalNetherlandsNigeriaNorthern AfricaNorthern EuropeNorwayOceaniaPakistanPanamaPeruPhilippinesPolandPortugalRomaniaRussiaSaudi ArabiaScotlandSerbiaSingaporeSouth AfricaSouth AmericaSouth Central AsiaSouth Eastern AsiaSouthern EuropeSpainSri LankaSudanSwedenSwitzerlandSyriaTaiwanThailandTrinidad and TobagoTurkeyUgandaUkraineUzbekistanVenezuelaVietnamWestern AfricaWestern AsiaWestern EuropeZaire
Immigrant Origin (Percentage)
AfghanistanAfricaAlbaniaArgentinaAsiaAustraliaAustriaBahamasBangladeshBelarusBelgiumBoliviaBosnia and HerzegovinaBrazilBulgariaBurma / MyanmarCambodiaCameroonCanadaCaribbeanCentral AmericaChileChinaColombiaCongoCosta RicaCroatiaCubaCzechoslovakiaDenmarkDominican RepublicEastern AfricaEastern AsiaEastern EuropeEcuadorEgyptEl SalvadorEnglandEritreaEthiopiaEuropeFranceGermanyGhanaGreeceGuatemalaGuyanaHaitiHondurasHong KongHungaryIndiaIndonesiaIranIraqIrelandIsraelItalyJamaicaJapanJordanKazakhstanKenyaKoreaKuwaitLatin AmericaLatviaLebanonLiberiaLithuaniaMalaysiaMexicoMiddle AfricaMoldovaMoroccoNepalNetherlandsNigeriaNorthern AfricaNorthern EuropeNorwayOceaniaPakistanPanamaPeruPhilippinesPolandPortugalRomaniaRussiaSaudi ArabiaScotlandSerbiaSingaporeSouth AfricaSouth AmericaSouth Central AsiaSouth Eastern AsiaSouthern EuropeSpainSri LankaSudanSwedenSwitzerlandSyriaTaiwanThailandTrinidad and TobagoTurkeyUgandaUkraineUzbekistanVenezuelaVietnamWestern AfricaWestern AsiaWestern EuropeZaire
Income
Income (Families)
Income (Households)
Poverty
Poverty (Families)
Unemployment
Employment Occupations
Employment Industries
Employer Class
Commute Time
Commute Means
School Enrollment
Education by Degree Field
Occupancy
Finances
Physical Characteristics
Pittsburgh
Compare Zip Codes
Comparison Subject

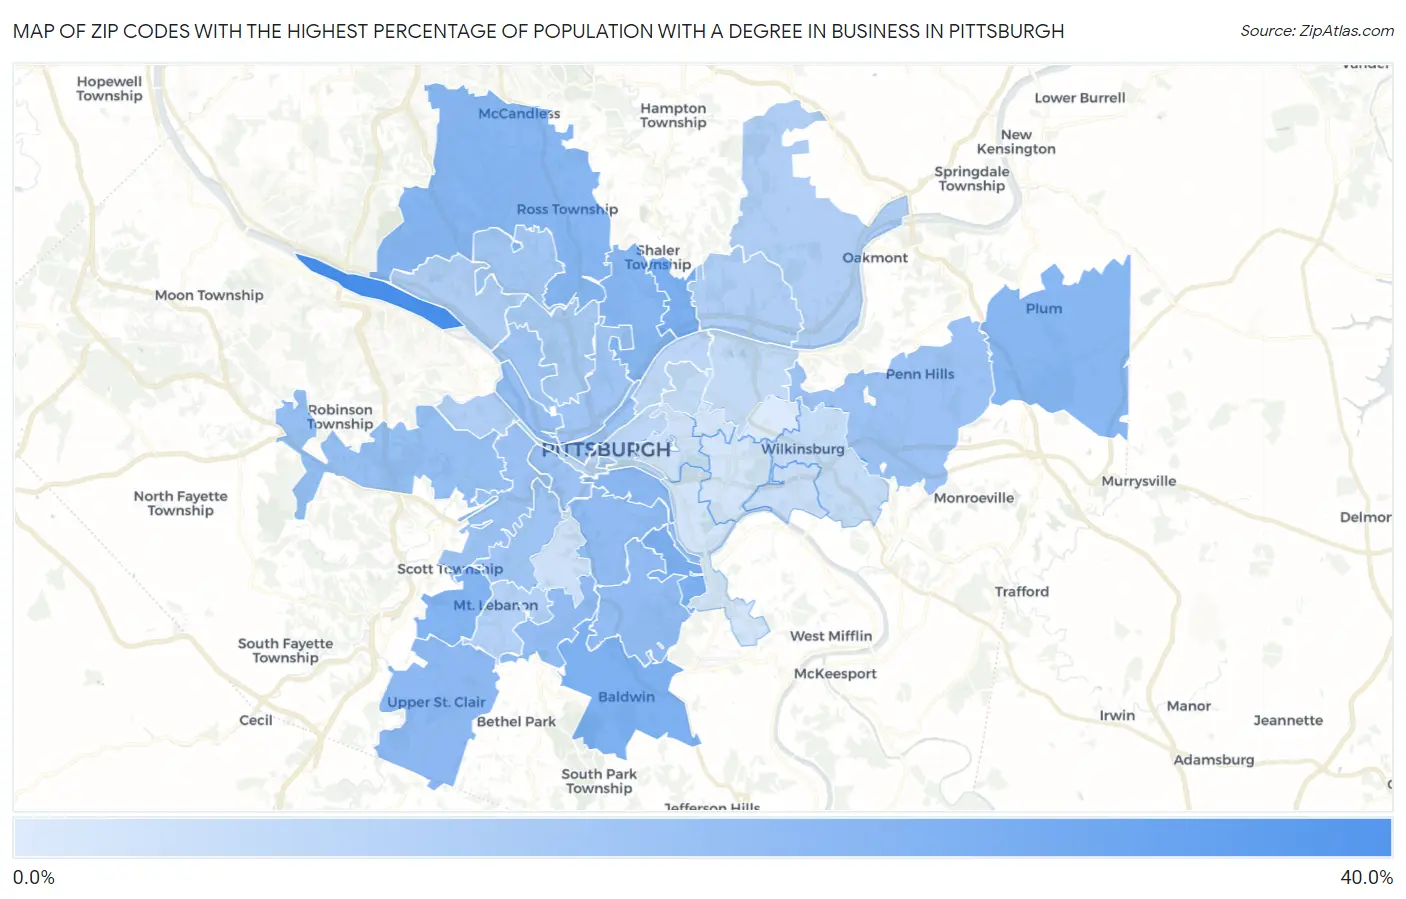
Map of Zip Codes with the Highest Percentage of Population with a Degree in Business in Pittsburgh

0.0%
40.0%
Zip Codes with the Highest Percentage of Population with a Degree in Business in Pittsburgh Map

Zip Codes with the Highest Percentage of Population with a Degree in Business in Pittsburgh, PA

Zip Code % Graduates vs State vs National
1.1522536.1%18.9%(+17.2)#9719.5%(+16.6)#1,595
2.1522325.5%18.9%(+6.62)#22019.5%(+6.00)#5,255
3.1523625.0%18.9%(+6.11)#24019.5%(+5.49)#5,718
4.1524324.1%18.9%(+5.23)#27219.5%(+4.61)#6,500
5.1520923.7%18.9%(+4.77)#29419.5%(+4.15)#6,965
6.1523923.4%18.9%(+4.57)#30319.5%(+3.95)#7,176
7.1523723.3%18.9%(+4.47)#31319.5%(+3.85)#7,278
8.1520323.1%18.9%(+4.26)#32619.5%(+3.64)#7,501
9.1524122.7%18.9%(+3.80)#35119.5%(+3.18)#7,994
10.1521021.8%18.9%(+2.92)#40119.5%(+2.30)#9,084
11.1522721.8%18.9%(+2.92)#40219.5%(+2.30)#9,086
12.1523421.8%18.9%(+2.87)#40619.5%(+2.26)#9,141
13.1520520.9%18.9%(+2.05)#45819.5%(+1.43)#10,246
14.1523320.5%18.9%(+1.59)#50119.5%(+0.974)#10,926
15.1523519.8%18.9%(+0.896)#57019.5%(+0.277)#11,956
16.1522219.7%18.9%(+0.836)#57919.5%(+0.217)#12,046
17.1521119.7%18.9%(+0.811)#58219.5%(+0.192)#12,078
18.1522019.6%18.9%(+0.697)#59119.5%(+0.078)#12,248
19.1521619.1%18.9%(+0.254)#62019.5%(-0.365)#12,924
20.1521218.8%18.9%(-0.053)#64019.5%(-0.672)#13,391
21.1522918.3%18.9%(-0.606)#68119.5%(-1.23)#14,184
22.1528217.6%18.9%(-1.23)#74219.5%(-1.85)#15,092
23.1521417.6%18.9%(-1.30)#75719.5%(-1.91)#15,193
24.1520416.5%18.9%(-2.37)#86019.5%(-2.99)#16,881
25.1523816.5%18.9%(-2.41)#86519.5%(-3.03)#16,940
26.1521516.4%18.9%(-2.49)#87119.5%(-3.11)#17,051
27.1520216.3%18.9%(-2.63)#88719.5%(-3.25)#17,241
28.1522815.4%18.9%(-3.51)#95819.5%(-4.13)#18,464
29.1521914.0%18.9%(-4.91)#1,06219.5%(-5.53)#20,282
30.1520113.8%18.9%(-5.08)#1,07419.5%(-5.70)#20,488
31.1522412.7%18.9%(-6.15)#1,13719.5%(-6.77)#21,750
32.1520612.7%18.9%(-6.19)#1,14019.5%(-6.81)#21,786
33.1522112.4%18.9%(-6.49)#1,15419.5%(-7.10)#22,090
34.1521811.9%18.9%(-7.02)#1,18919.5%(-7.64)#22,638
35.1522610.9%18.9%(-7.95)#1,24519.5%(-8.57)#23,531
36.1521310.8%18.9%(-8.06)#1,24819.5%(-8.67)#23,638
37.1521710.2%18.9%(-8.68)#1,27919.5%(-9.30)#24,206
38.1520710.0%18.9%(-8.83)#1,28519.5%(-9.45)#24,308
39.1523210.0%18.9%(-8.85)#1,28619.5%(-9.47)#24,318
40.152088.6%18.9%(-10.3)#1,35819.5%(-10.9)#25,483

Common Questions

What are the Top 10 Zip Codes with the Highest Percentage of Population with a Degree in Business in Pittsburgh, PA?
Top 10 Zip Codes with the Highest Percentage of Population with a Degree in Business in Pittsburgh, PA are:
#1
36.1%
#2
25.5%
#3
25.0%
#4
24.1%
#5
23.7%
#6
23.4%
#7
23.3%
#8
23.1%
#9
22.7%
#10
21.8%
What zip code has the Highest Percentage of Population with a Degree in Business in Pittsburgh, PA?
15225 has the Highest Percentage of Population with a Degree in Business in Pittsburgh, PA with 36.1%.
What is the Percentage of Population with a Degree in Business in Pittsburgh, PA?
Percentage of Population with a Degree in Business in Pittsburgh is 14.1%.
What is the Percentage of Population with a Degree in Business in Pennsylvania?
Percentage of Population with a Degree in Business in Pennsylvania is 18.9%.
What is the Percentage of Population with a Degree in Business in the United States?
Percentage of Population with a Degree in Business in the United States is 19.5%.