Zip Codes with the Highest Percentage of Population with a Degree in Communications in Pittsburgh, PA
RELATED REPORTS & OPTIONS
Communications
Pittsburgh
Compare Zip Codes
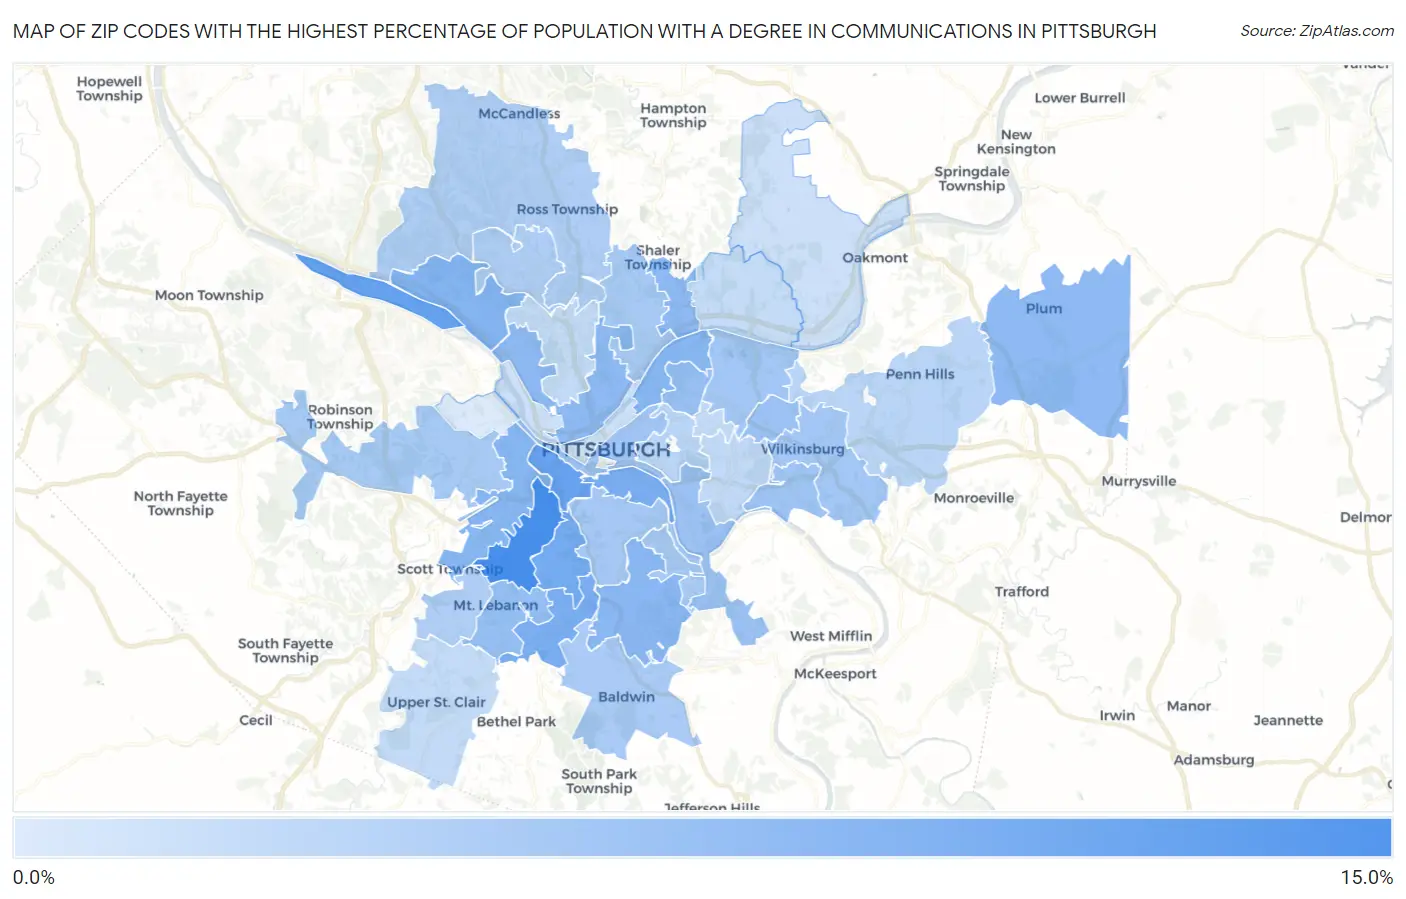
Map of Zip Codes with the Highest Percentage of Population with a Degree in Communications in Pittsburgh
2.6%
11.0%
Zip Codes with the Highest Percentage of Population with a Degree in Communications in Pittsburgh, PA
| Zip Code | % Graduates | vs State | vs National | |
| 1. | 15216 | 11.0% | 4.2%(+6.86)#64 | 4.1%(+6.91)#976 |
| 2. | 15225 | 9.3% | 4.2%(+5.10)#90 | 4.1%(+5.15)#1,331 |
| 3. | 15211 | 9.2% | 4.2%(+5.03)#93 | 4.1%(+5.09)#1,350 |
| 4. | 15226 | 8.4% | 4.2%(+4.23)#112 | 4.1%(+4.29)#1,670 |
| 5. | 15234 | 8.2% | 4.2%(+3.97)#120 | 4.1%(+4.02)#1,794 |
| 6. | 15203 | 8.1% | 4.2%(+3.90)#124 | 4.1%(+3.96)#1,828 |
| 7. | 15202 | 7.4% | 4.2%(+3.25)#153 | 4.1%(+3.30)#2,239 |
| 8. | 15201 | 7.4% | 4.2%(+3.22)#155 | 4.1%(+3.27)#2,259 |
| 9. | 15220 | 7.3% | 4.2%(+3.12)#165 | 4.1%(+3.17)#2,332 |
| 10. | 15227 | 7.2% | 4.2%(+2.99)#175 | 4.1%(+3.04)#2,451 |
| 11. | 15212 | 7.0% | 4.2%(+2.78)#186 | 4.1%(+2.84)#2,633 |
| 12. | 15239 | 7.0% | 4.2%(+2.78)#187 | 4.1%(+2.83)#2,636 |
| 13. | 15223 | 7.0% | 4.2%(+2.78)#188 | 4.1%(+2.83)#2,637 |
| 14. | 15228 | 6.6% | 4.2%(+2.41)#208 | 4.1%(+2.46)#3,019 |
| 15. | 15224 | 6.4% | 4.2%(+2.26)#215 | 4.1%(+2.31)#3,193 |
| 16. | 15208 | 6.2% | 4.2%(+2.06)#226 | 4.1%(+2.11)#3,431 |
| 17. | 15207 | 6.1% | 4.2%(+1.95)#233 | 4.1%(+2.01)#3,557 |
| 18. | 15218 | 6.1% | 4.2%(+1.89)#241 | 4.1%(+1.94)#3,659 |
| 19. | 15219 | 5.9% | 4.2%(+1.72)#259 | 4.1%(+1.78)#3,917 |
| 20. | 15221 | 5.8% | 4.2%(+1.64)#264 | 4.1%(+1.69)#4,064 |
| 21. | 15206 | 5.8% | 4.2%(+1.62)#266 | 4.1%(+1.68)#4,095 |
| 22. | 15210 | 5.6% | 4.2%(+1.43)#279 | 4.1%(+1.49)#4,401 |
| 23. | 15205 | 5.6% | 4.2%(+1.39)#285 | 4.1%(+1.45)#4,484 |
| 24. | 15209 | 5.5% | 4.2%(+1.36)#292 | 4.1%(+1.41)#4,567 |
| 25. | 15236 | 5.4% | 4.2%(+1.21)#310 | 4.1%(+1.26)#4,849 |
| 26. | 15229 | 5.1% | 4.2%(+0.951)#330 | 4.1%(+1.01)#5,378 |
| 27. | 15243 | 5.1% | 4.2%(+0.914)#334 | 4.1%(+0.969)#5,453 |
| 28. | 15237 | 5.1% | 4.2%(+0.913)#335 | 4.1%(+0.967)#5,456 |
| 29. | 15235 | 4.5% | 4.2%(+0.335)#429 | 4.1%(+0.389)#6,887 |
| 30. | 15213 | 4.5% | 4.2%(+0.333)#430 | 4.1%(+0.388)#6,894 |
| 31. | 15217 | 4.1% | 4.2%(-0.045)#495 | 4.1%(+0.010)#8,080 |
| 32. | 15241 | 4.1% | 4.2%(-0.105)#503 | 4.1%(-0.051)#8,288 |
| 33. | 15214 | 4.1% | 4.2%(-0.134)#509 | 4.1%(-0.079)#8,393 |
| 34. | 15232 | 4.0% | 4.2%(-0.221)#529 | 4.1%(-0.166)#8,680 |
| 35. | 15215 | 3.9% | 4.2%(-0.274)#539 | 4.1%(-0.219)#8,858 |
| 36. | 15238 | 3.6% | 4.2%(-0.612)#592 | 4.1%(-0.557)#10,023 |
| 37. | 15222 | 3.5% | 4.2%(-0.672)#603 | 4.1%(-0.618)#10,260 |
| 38. | 15233 | 3.5% | 4.2%(-0.732)#619 | 4.1%(-0.677)#10,476 |
| 39. | 15204 | 2.6% | 4.2%(-1.54)#769 | 4.1%(-1.49)#13,607 |
1
Common Questions
What are the Top 10 Zip Codes with the Highest Percentage of Population with a Degree in Communications in Pittsburgh, PA?
Top 10 Zip Codes with the Highest Percentage of Population with a Degree in Communications in Pittsburgh, PA are:
What zip code has the Highest Percentage of Population with a Degree in Communications in Pittsburgh, PA?
15216 has the Highest Percentage of Population with a Degree in Communications in Pittsburgh, PA with 11.0%.
What is the Percentage of Population with a Degree in Communications in Pittsburgh, PA?
Percentage of Population with a Degree in Communications in Pittsburgh is 5.9%.
What is the Percentage of Population with a Degree in Communications in Pennsylvania?
Percentage of Population with a Degree in Communications in Pennsylvania is 4.2%.
What is the Percentage of Population with a Degree in Communications in the United States?
Percentage of Population with a Degree in Communications in the United States is 4.1%.