Zip Codes with the Highest Percentage of Population Employed in Legal Services & Support in Pittsburgh, PA
RELATED REPORTS & OPTIONS
Legal Services & Support
Pittsburgh
Compare Zip Codes
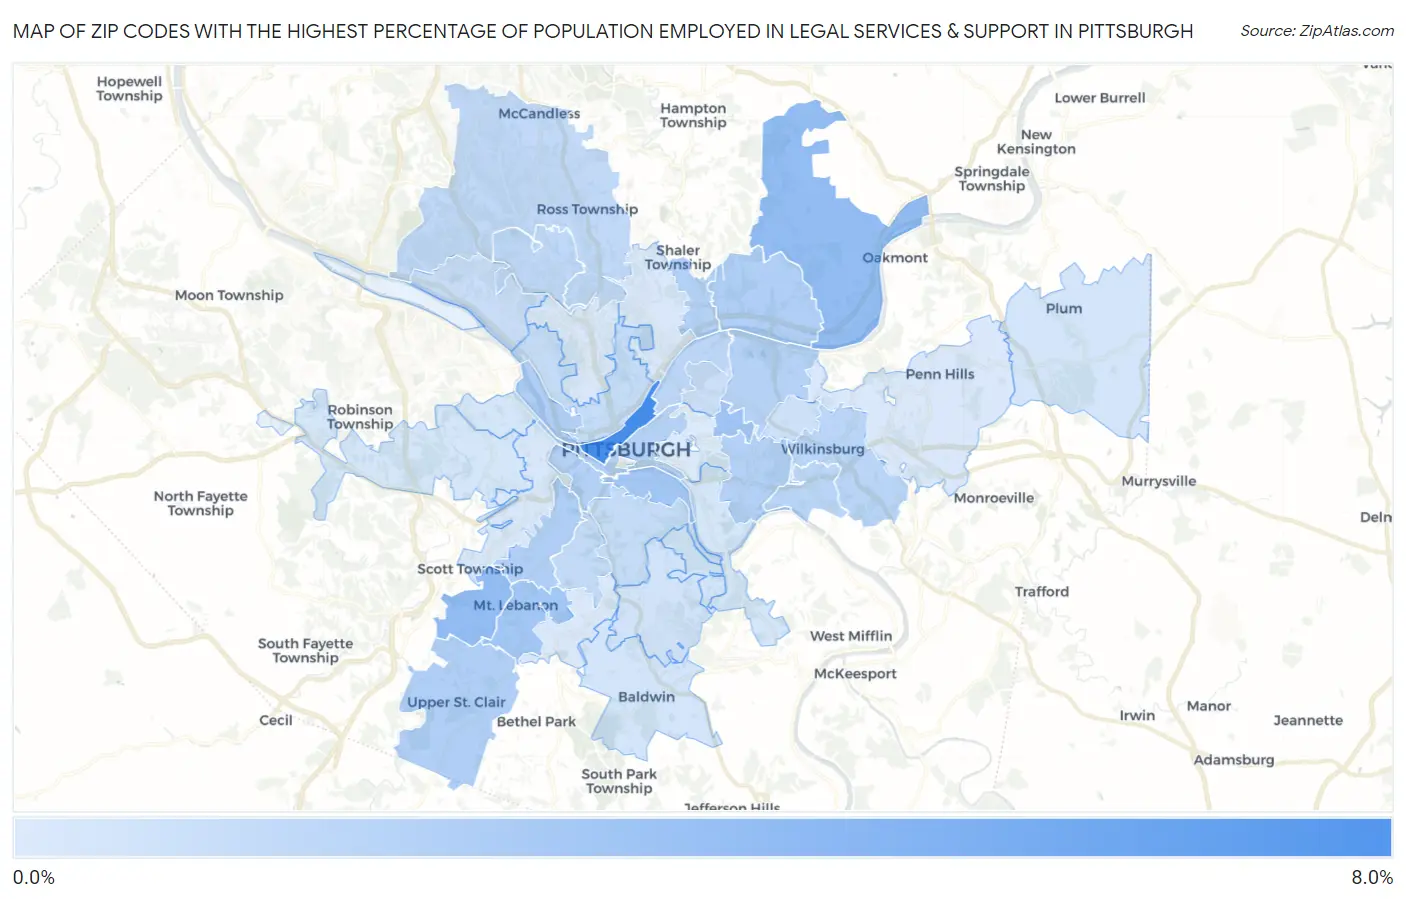
Map of Zip Codes with the Highest Percentage of Population Employed in Legal Services & Support in Pittsburgh
0.78%
7.5%
Zip Codes with the Highest Percentage of Population Employed in Legal Services & Support in Pittsburgh, PA
| Zip Code | % Employed | vs State | vs National | |
| 1. | 15222 | 7.5% | 1.1%(+6.38)#12 | 1.2%(+6.34)#297 |
| 2. | 15238 | 4.1% | 1.1%(+2.95)#53 | 1.2%(+2.91)#1,081 |
| 3. | 15243 | 4.0% | 1.1%(+2.88)#55 | 1.2%(+2.85)#1,109 |
| 4. | 15232 | 3.4% | 1.1%(+2.23)#71 | 1.2%(+2.20)#1,513 |
| 5. | 15228 | 3.4% | 1.1%(+2.21)#72 | 1.2%(+2.17)#1,532 |
| 6. | 15203 | 3.3% | 1.1%(+2.17)#75 | 1.2%(+2.13)#1,562 |
| 7. | 15216 | 2.7% | 1.1%(+1.60)#92 | 1.2%(+1.56)#2,142 |
| 8. | 15233 | 2.7% | 1.1%(+1.57)#93 | 1.2%(+1.54)#2,174 |
| 9. | 15215 | 2.7% | 1.1%(+1.53)#98 | 1.2%(+1.50)#2,230 |
| 10. | 15241 | 2.7% | 1.1%(+1.53)#99 | 1.2%(+1.49)#2,239 |
| 11. | 15217 | 2.6% | 1.1%(+1.44)#110 | 1.2%(+1.40)#2,372 |
| 12. | 15211 | 2.6% | 1.1%(+1.43)#111 | 1.2%(+1.39)#2,396 |
| 13. | 15223 | 2.5% | 1.1%(+1.36)#115 | 1.2%(+1.32)#2,505 |
| 14. | 15206 | 2.5% | 1.1%(+1.35)#116 | 1.2%(+1.32)#2,509 |
| 15. | 15219 | 2.5% | 1.1%(+1.33)#117 | 1.2%(+1.29)#2,554 |
| 16. | 15218 | 2.3% | 1.1%(+1.13)#133 | 1.2%(+1.09)#2,878 |
| 17. | 15221 | 2.2% | 1.1%(+1.10)#134 | 1.2%(+1.07)#2,939 |
| 18. | 15201 | 2.2% | 1.1%(+1.03)#143 | 1.2%(+0.992)#3,078 |
| 19. | 15229 | 2.1% | 1.1%(+0.925)#152 | 1.2%(+0.889)#3,288 |
| 20. | 15237 | 1.9% | 1.1%(+0.800)#165 | 1.2%(+0.763)#3,607 |
| 21. | 15226 | 1.9% | 1.1%(+0.778)#167 | 1.2%(+0.742)#3,661 |
| 22. | 15212 | 1.8% | 1.1%(+0.641)#177 | 1.2%(+0.605)#4,034 |
| 23. | 15210 | 1.8% | 1.1%(+0.624)#181 | 1.2%(+0.587)#4,079 |
| 24. | 15202 | 1.6% | 1.1%(+0.464)#208 | 1.2%(+0.427)#4,636 |
| 25. | 15224 | 1.6% | 1.1%(+0.445)#211 | 1.2%(+0.408)#4,701 |
| 26. | 15208 | 1.4% | 1.1%(+0.252)#245 | 1.2%(+0.216)#5,482 |
| 27. | 15227 | 1.3% | 1.1%(+0.169)#262 | 1.2%(+0.133)#5,856 |
| 28. | 15236 | 1.2% | 1.1%(+0.033)#295 | 1.2%(-0.003)#6,639 |
| 29. | 15239 | 1.1% | 1.1%(-0.007)#314 | 1.2%(-0.043)#6,880 |
| 30. | 15205 | 1.1% | 1.1%(-0.025)#318 | 1.2%(-0.062)#7,002 |
| 31. | 15204 | 1.1% | 1.1%(-0.028)#319 | 1.2%(-0.065)#7,025 |
| 32. | 15207 | 1.0% | 1.1%(-0.104)#347 | 1.2%(-0.140)#7,533 |
| 33. | 15220 | 0.96% | 1.1%(-0.191)#383 | 1.2%(-0.227)#8,152 |
| 34. | 15214 | 0.93% | 1.1%(-0.219)#395 | 1.2%(-0.256)#8,366 |
| 35. | 15235 | 0.90% | 1.1%(-0.248)#406 | 1.2%(-0.284)#8,603 |
| 36. | 15234 | 0.86% | 1.1%(-0.286)#424 | 1.2%(-0.323)#8,921 |
| 37. | 15209 | 0.85% | 1.1%(-0.298)#429 | 1.2%(-0.335)#9,029 |
| 38. | 15213 | 0.78% | 1.1%(-0.368)#464 | 1.2%(-0.404)#9,644 |
1
Common Questions
What are the Top 10 Zip Codes with the Highest Percentage of Population Employed in Legal Services & Support in Pittsburgh, PA?
Top 10 Zip Codes with the Highest Percentage of Population Employed in Legal Services & Support in Pittsburgh, PA are:
What zip code has the Highest Percentage of Population Employed in Legal Services & Support in Pittsburgh, PA?
15222 has the Highest Percentage of Population Employed in Legal Services & Support in Pittsburgh, PA with 7.5%.
What is the Percentage of Population Employed in Legal Services & Support in Pittsburgh, PA?
Percentage of Population Employed in Legal Services & Support in Pittsburgh is 2.1%.
What is the Percentage of Population Employed in Legal Services & Support in Pennsylvania?
Percentage of Population Employed in Legal Services & Support in Pennsylvania is 1.1%.
What is the Percentage of Population Employed in Legal Services & Support in the United States?
Percentage of Population Employed in Legal Services & Support in the United States is 1.2%.