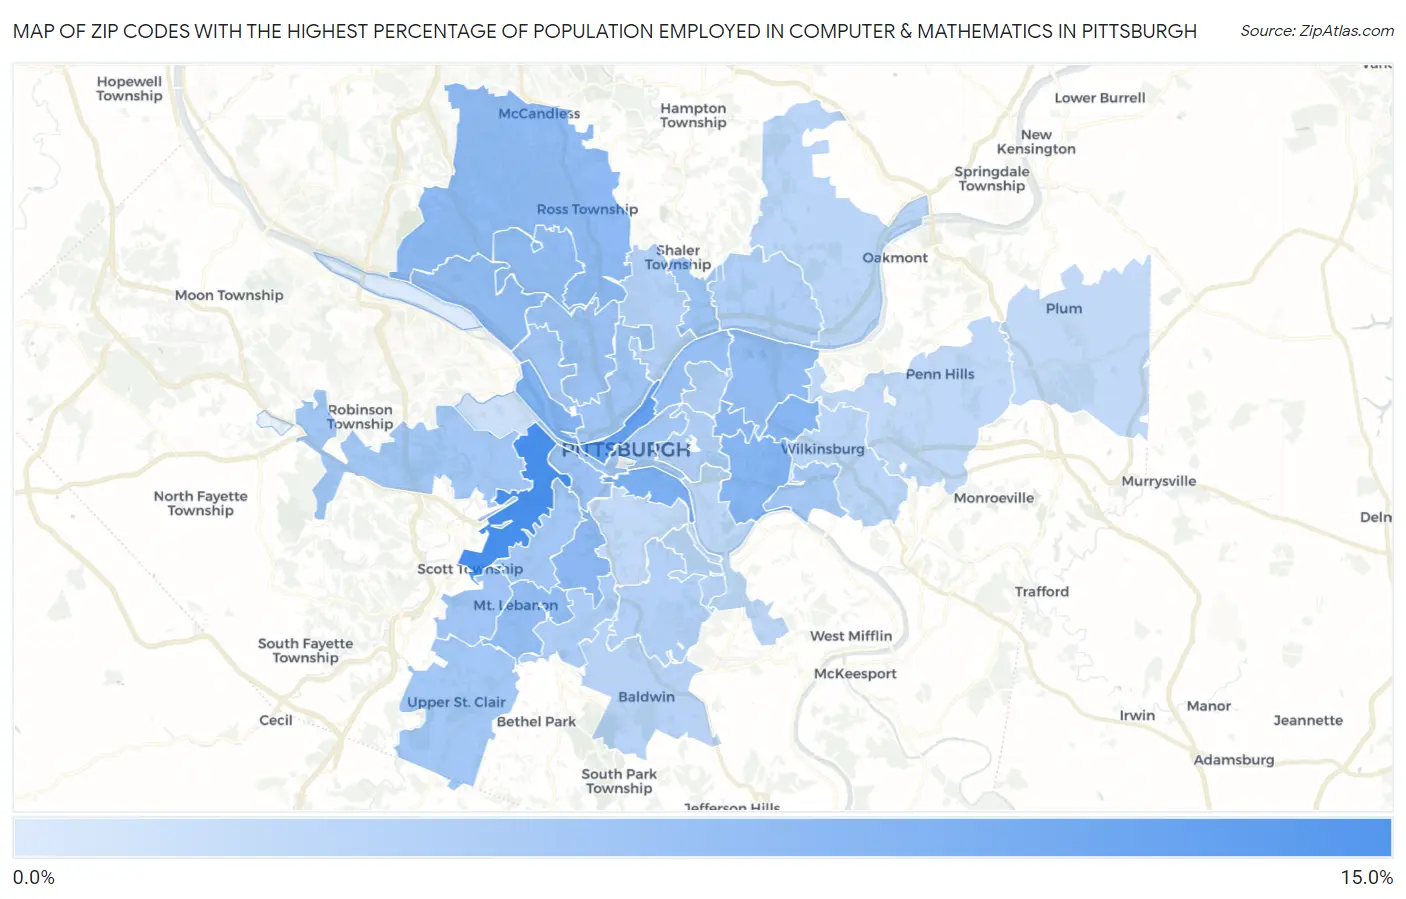
Zip Codes with the Highest Percentage of Population Employed in Computer & Mathematics in Pittsburgh, PA
RELATED REPORTS & OPTIONS
Computer & Mathematics
Pittsburgh
Compare Zip Codes
Map of Zip Codes with the Highest Percentage of Population Employed in Computer & Mathematics in Pittsburgh
1.4%
12.8%

Zip Codes with the Highest Percentage of Population Employed in Computer & Mathematics in Pittsburgh, PA
| Zip Code | % Employed | vs State | vs National | |
| 1. | 15220 | 12.8% | 3.3%(+9.48)#24 | 3.5%(+9.24)#378 |
| 2. | 15222 | 10.4% | 3.3%(+7.14)#30 | 3.5%(+6.90)#645 |
| 3. | 15203 | 8.5% | 3.3%(+5.26)#51 | 3.5%(+5.02)#1,039 |
| 4. | 15233 | 8.1% | 3.3%(+4.82)#61 | 3.5%(+4.58)#1,179 |
| 5. | 15217 | 8.0% | 3.3%(+4.69)#64 | 3.5%(+4.44)#1,218 |
| 6. | 15208 | 7.9% | 3.3%(+4.58)#65 | 3.5%(+4.33)#1,258 |
| 7. | 15232 | 7.5% | 3.3%(+4.24)#71 | 3.5%(+3.99)#1,385 |
| 8. | 15226 | 7.4% | 3.3%(+4.15)#72 | 3.5%(+3.91)#1,414 |
| 9. | 15237 | 7.2% | 3.3%(+3.95)#78 | 3.5%(+3.70)#1,496 |
| 10. | 15202 | 7.0% | 3.3%(+3.76)#88 | 3.5%(+3.52)#1,602 |
| 11. | 15229 | 7.0% | 3.3%(+3.74)#90 | 3.5%(+3.49)#1,618 |
| 12. | 15206 | 6.9% | 3.3%(+3.65)#97 | 3.5%(+3.40)#1,667 |
| 13. | 15228 | 6.9% | 3.3%(+3.60)#99 | 3.5%(+3.35)#1,689 |
| 14. | 15201 | 6.5% | 3.3%(+3.24)#108 | 3.5%(+2.99)#1,915 |
| 15. | 15211 | 6.3% | 3.3%(+3.02)#116 | 3.5%(+2.78)#2,084 |
| 16. | 15214 | 6.2% | 3.3%(+2.90)#123 | 3.5%(+2.65)#2,162 |
| 17. | 15223 | 6.0% | 3.3%(+2.76)#131 | 3.5%(+2.51)#2,286 |
| 18. | 15212 | 5.9% | 3.3%(+2.59)#142 | 3.5%(+2.34)#2,438 |
| 19. | 15243 | 5.8% | 3.3%(+2.53)#145 | 3.5%(+2.28)#2,490 |
| 20. | 15205 | 5.7% | 3.3%(+2.38)#153 | 3.5%(+2.13)#2,629 |
| 21. | 15241 | 5.7% | 3.3%(+2.37)#154 | 3.5%(+2.13)#2,634 |
| 22. | 15216 | 5.6% | 3.3%(+2.34)#158 | 3.5%(+2.09)#2,666 |
| 23. | 15219 | 5.6% | 3.3%(+2.30)#159 | 3.5%(+2.05)#2,703 |
| 24. | 15218 | 5.5% | 3.3%(+2.27)#161 | 3.5%(+2.02)#2,734 |
| 25. | 15234 | 4.9% | 3.3%(+1.60)#203 | 3.5%(+1.35)#3,537 |
| 26. | 15224 | 4.8% | 3.3%(+1.54)#206 | 3.5%(+1.30)#3,615 |
| 27. | 15213 | 4.7% | 3.3%(+1.46)#213 | 3.5%(+1.22)#3,724 |
| 28. | 15215 | 4.6% | 3.3%(+1.37)#219 | 3.5%(+1.12)#3,870 |
| 29. | 15209 | 4.4% | 3.3%(+1.14)#231 | 3.5%(+0.893)#4,239 |
| 30. | 15227 | 4.3% | 3.3%(+1.07)#235 | 3.5%(+0.821)#4,353 |
| 31. | 15236 | 4.1% | 3.3%(+0.815)#261 | 3.5%(+0.567)#4,839 |
| 32. | 15221 | 3.9% | 3.3%(+0.654)#280 | 3.5%(+0.406)#5,191 |
| 33. | 15238 | 3.9% | 3.3%(+0.611)#285 | 3.5%(+0.363)#5,278 |
| 34. | 15207 | 3.8% | 3.3%(+0.542)#293 | 3.5%(+0.294)#5,432 |
| 35. | 15235 | 3.6% | 3.3%(+0.368)#320 | 3.5%(+0.120)#5,854 |
| 36. | 15239 | 3.4% | 3.3%(+0.102)#358 | 3.5%(-0.147)#6,548 |
| 37. | 15210 | 3.3% | 3.3%(+0.069)#367 | 3.5%(-0.179)#6,639 |
| 38. | 15204 | 2.5% | 3.3%(-0.758)#533 | 3.5%(-1.01)#9,567 |
| 39. | 15225 | 1.4% | 3.3%(-1.88)#814 | 3.5%(-2.12)#14,956 |
1
Common Questions
What are the Top 10 Zip Codes with the Highest Percentage of Population Employed in Computer & Mathematics in Pittsburgh, PA?
Top 10 Zip Codes with the Highest Percentage of Population Employed in Computer & Mathematics in Pittsburgh, PA are:
What zip code has the Highest Percentage of Population Employed in Computer & Mathematics in Pittsburgh, PA?
15220 has the Highest Percentage of Population Employed in Computer & Mathematics in Pittsburgh, PA with 12.8%.
What is the Percentage of Population Employed in Computer & Mathematics in Pittsburgh, PA?
Percentage of Population Employed in Computer & Mathematics in Pittsburgh is 5.9%.
What is the Percentage of Population Employed in Computer & Mathematics in Pennsylvania?
Percentage of Population Employed in Computer & Mathematics in Pennsylvania is 3.3%.
What is the Percentage of Population Employed in Computer & Mathematics in the United States?
Percentage of Population Employed in Computer & Mathematics in the United States is 3.5%.