Klamath County, OR Map & Demographics
Klamath County Map
Klamath County Overview
$31,260
PER CAPITA INCOME
$69,223
AVG FAMILY INCOME
$57,219
AVG HOUSEHOLD INCOME
28.8%
WAGE / INCOME GAP [ % ]
71.2¢/ $1
WAGE / INCOME GAP [ $ ]
$12,045
FAMILY INCOME DEFICIT
0.47
INEQUALITY / GINI INDEX
69,506
TOTAL POPULATION
34,762
MALE POPULATION
34,744
FEMALE POPULATION
100.05
MALES / 100 FEMALES
99.95
FEMALES / 100 MALES
41.1
MEDIAN AGE
3.0
AVG FAMILY SIZE
2.4
AVG HOUSEHOLD SIZE
29,392
LABOR FORCE [ PEOPLE ]
52.5%
PERCENT IN LABOR FORCE
7.6%
UNEMPLOYMENT RATE
Klamath County Area Codes
Income in Klamath County
Income Overview in Klamath County
Per Capita Income in Klamath County is $31,260, while median incomes of families and households are $69,223 and $57,219 respectively.
| Characteristic | Number | Measure |
| Per Capita Income | 69,506 | $31,260 |
| Median Family Income | 17,134 | $69,223 |
| Mean Family Income | 17,134 | $88,533 |
| Median Household Income | 28,186 | $57,219 |
| Mean Household Income | 28,186 | $75,121 |
| Income Deficit | 17,134 | $12,045 |
| Wage / Income Gap (%) | 69,506 | 28.75% |
| Wage / Income Gap ($) | 69,506 | 71.25¢ per $1 |
| Gini / Inequality Index | 69,506 | 0.47 |
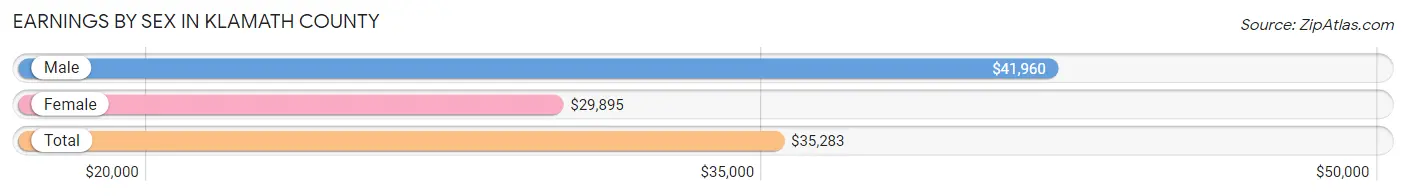
Earnings by Sex in Klamath County
Average Earnings in Klamath County are $35,283, $41,960 for men and $29,895 for women, a difference of 28.7%.
| Sex | Number | Average Earnings |
| Male | 16,707 (53.2%) | $41,960 |
| Female | 14,708 (46.8%) | $29,895 |
| Total | 31,415 (100.0%) | $35,283 |
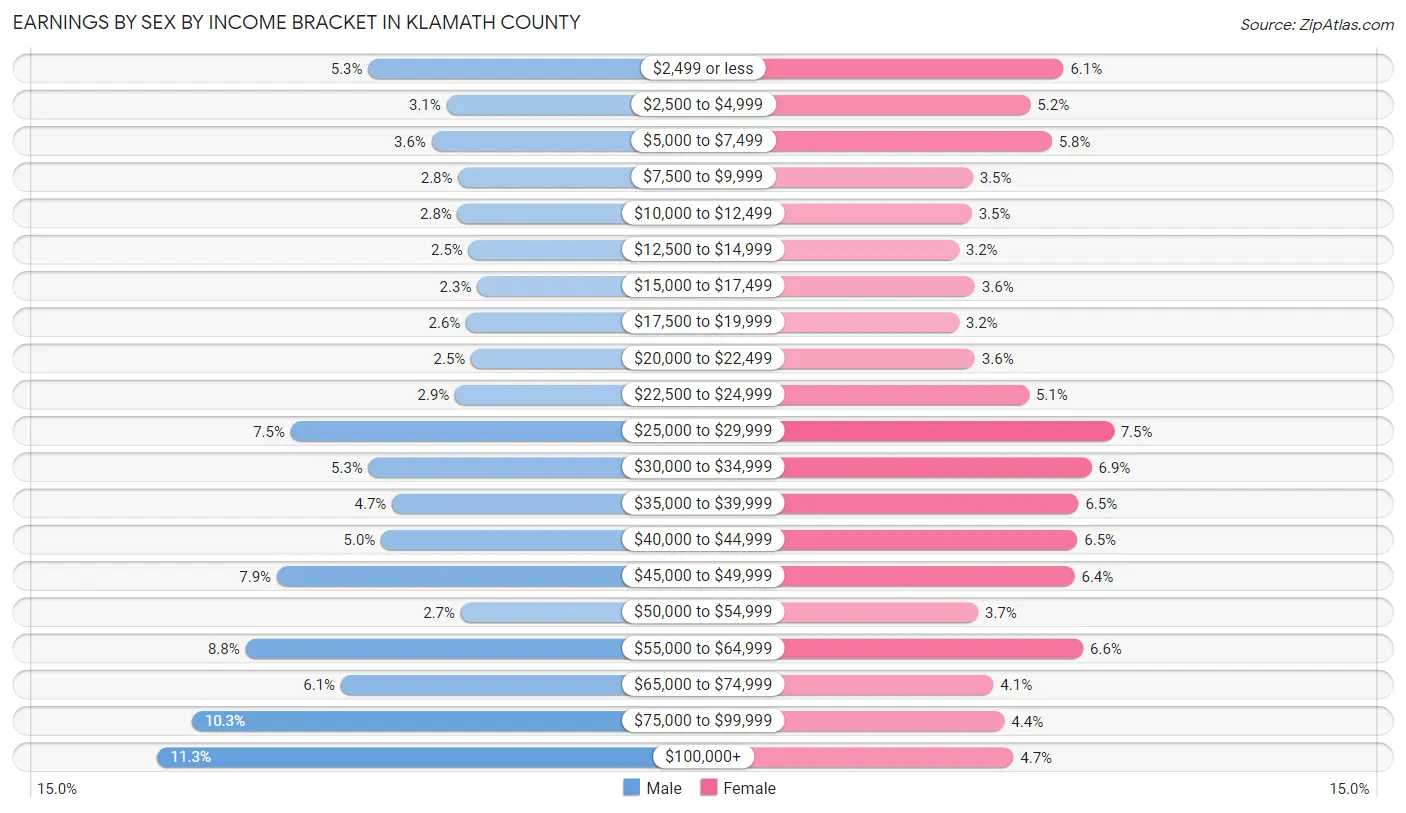
Earnings by Sex by Income Bracket in Klamath County
The most common earnings brackets in Klamath County are $100,000+ for men (1,881 | 11.3%) and $25,000 to $29,999 for women (1,103 | 7.5%).
| Income | Male | Female |
| $2,499 or less | 892 (5.3%) | 895 (6.1%) |
| $2,500 to $4,999 | 525 (3.1%) | 759 (5.2%) |
| $5,000 to $7,499 | 594 (3.6%) | 847 (5.8%) |
| $7,500 to $9,999 | 469 (2.8%) | 520 (3.5%) |
| $10,000 to $12,499 | 472 (2.8%) | 516 (3.5%) |
| $12,500 to $14,999 | 421 (2.5%) | 464 (3.2%) |
| $15,000 to $17,499 | 381 (2.3%) | 529 (3.6%) |
| $17,500 to $19,999 | 432 (2.6%) | 463 (3.2%) |
| $20,000 to $22,499 | 409 (2.5%) | 530 (3.6%) |
| $22,500 to $24,999 | 485 (2.9%) | 753 (5.1%) |
| $25,000 to $29,999 | 1,256 (7.5%) | 1,103 (7.5%) |
| $30,000 to $34,999 | 891 (5.3%) | 1,012 (6.9%) |
| $35,000 to $39,999 | 780 (4.7%) | 958 (6.5%) |
| $40,000 to $44,999 | 832 (5.0%) | 953 (6.5%) |
| $45,000 to $49,999 | 1,321 (7.9%) | 942 (6.4%) |
| $50,000 to $54,999 | 457 (2.7%) | 542 (3.7%) |
| $55,000 to $64,999 | 1,468 (8.8%) | 977 (6.6%) |
| $65,000 to $74,999 | 1,021 (6.1%) | 606 (4.1%) |
| $75,000 to $99,999 | 1,720 (10.3%) | 651 (4.4%) |
| $100,000+ | 1,881 (11.3%) | 688 (4.7%) |
| Total | 16,707 (100.0%) | 14,708 (100.0%) |
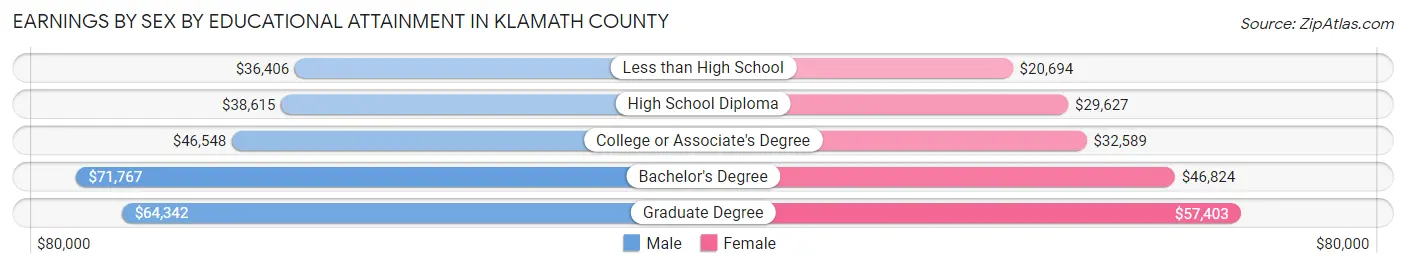
Earnings by Sex by Educational Attainment in Klamath County
Average earnings in Klamath County are $46,418 for men and $34,168 for women, a difference of 26.4%. Men with an educational attainment of bachelor's degree enjoy the highest average annual earnings of $71,767, while those with less than high school education earn the least with $36,406. Women with an educational attainment of graduate degree earn the most with the average annual earnings of $57,403, while those with less than high school education have the smallest earnings of $20,694.
| Educational Attainment | Male Income | Female Income |
| Less than High School | $36,406 | $20,694 |
| High School Diploma | $38,615 | $29,627 |
| College or Associate's Degree | $46,548 | $32,589 |
| Bachelor's Degree | $71,767 | $46,824 |
| Graduate Degree | $64,342 | $57,403 |
| Total | $46,418 | $34,168 |
Family Income in Klamath County
Family Income Brackets in Klamath County
According to the Klamath County family income data, there are 3,273 families falling into the $100,000 to $149,999 income range, which is the most common income bracket and makes up 19.1% of all families. Conversely, the $10,000 to $14,999 income bracket is the least frequent group with only 583 families (3.4%) belonging to this category.
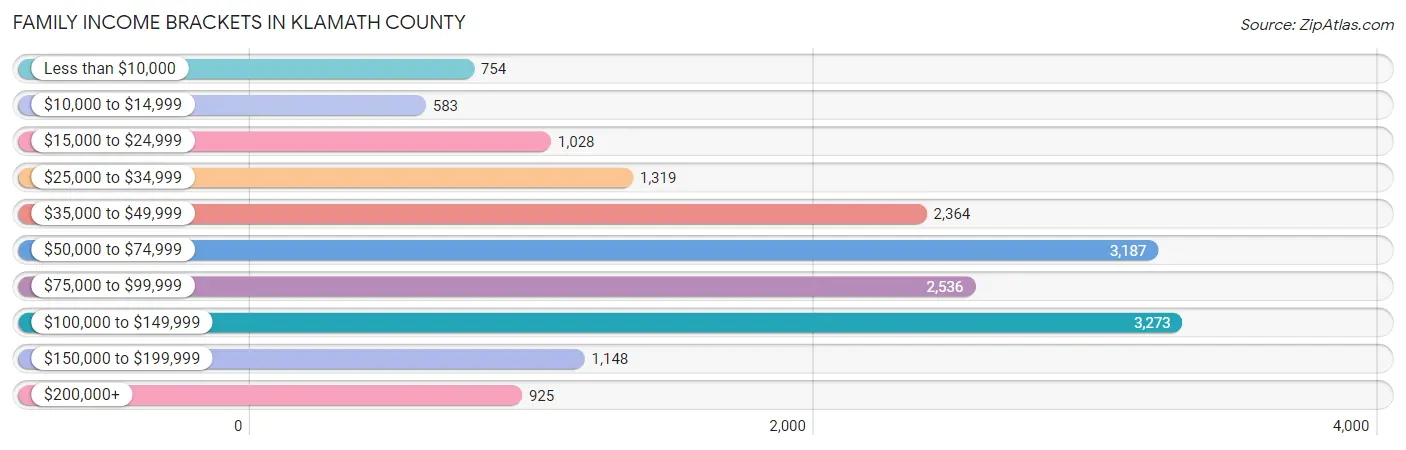
| Income Bracket | # Families | % Families |
| Less than $10,000 | 754 | 4.4% |
| $10,000 to $14,999 | 583 | 3.4% |
| $15,000 to $24,999 | 1,028 | 6.0% |
| $25,000 to $34,999 | 1,319 | 7.7% |
| $35,000 to $49,999 | 2,364 | 13.8% |
| $50,000 to $74,999 | 3,187 | 18.6% |
| $75,000 to $99,999 | 2,536 | 14.8% |
| $100,000 to $149,999 | 3,273 | 19.1% |
| $150,000 to $199,999 | 1,148 | 6.7% |
| $200,000+ | 925 | 5.4% |
Family Income by Famaliy Size in Klamath County
5-person families (1,230 | 7.2%) account for the highest median family income in Klamath County with $88,790 per family, while 2-person families (9,332 | 54.5%) have the highest median income of $33,264 per family member.
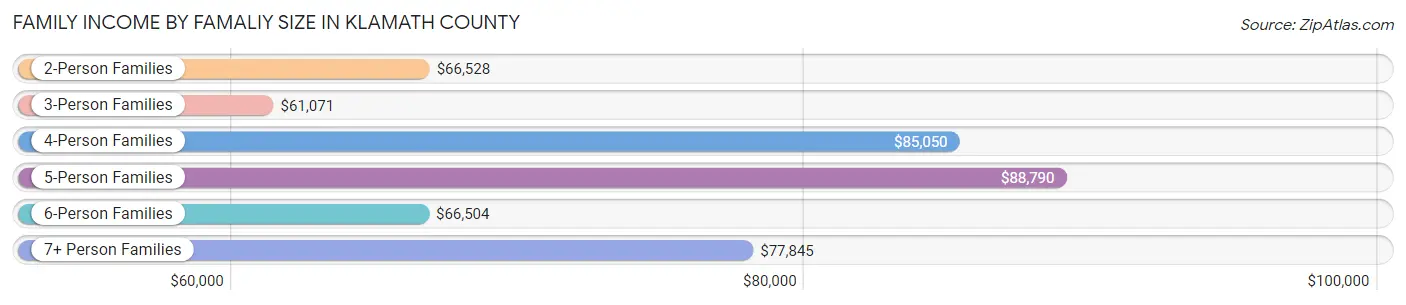
| Income Bracket | # Families | Median Income |
| 2-Person Families | 9,332 (54.5%) | $66,528 |
| 3-Person Families | 3,322 (19.4%) | $61,071 |
| 4-Person Families | 2,483 (14.5%) | $85,050 |
| 5-Person Families | 1,230 (7.2%) | $88,790 |
| 6-Person Families | 523 (3.0%) | $66,504 |
| 7+ Person Families | 244 (1.4%) | $77,845 |
| Total | 17,134 (100.0%) | $69,223 |
Family Income by Number of Earners in Klamath County
The median family income in Klamath County is $69,223, with families comprising 3+ earners (728) having the highest median family income of $103,980, while families with no earners (3,789) have the lowest median family income of $42,009, accounting for 4.3% and 22.1% of families, respectively.
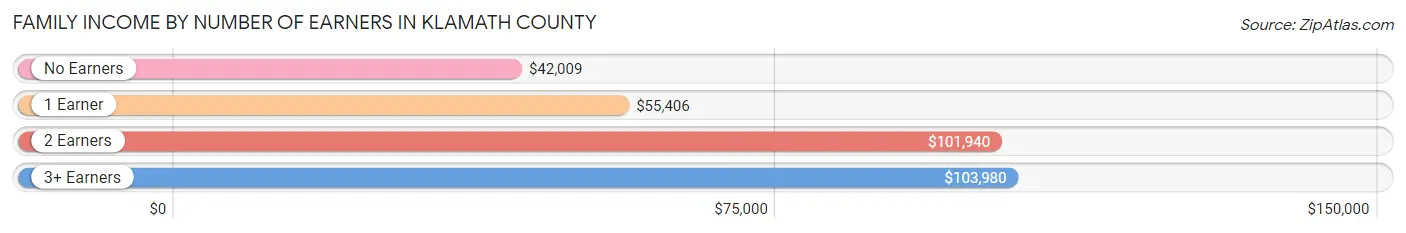
| Number of Earners | # Families | Median Income |
| No Earners | 3,789 (22.1%) | $42,009 |
| 1 Earner | 6,289 (36.7%) | $55,406 |
| 2 Earners | 6,328 (36.9%) | $101,940 |
| 3+ Earners | 728 (4.3%) | $103,980 |
| Total | 17,134 (100.0%) | $69,223 |
Household Income in Klamath County
Household Income Brackets in Klamath County
With 4,848 households falling in the category, the $50,000 to $74,999 income range is the most frequent in Klamath County, accounting for 17.2% of all households. In contrast, only 1,156 households (4.1%) fall into the $200,000+ income bracket, making it the least populous group.
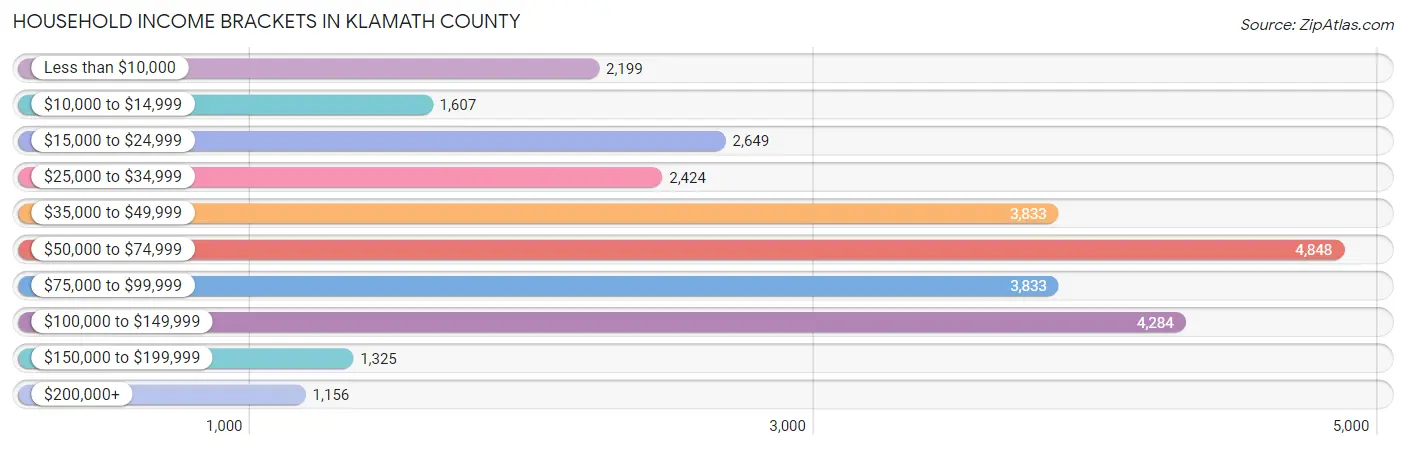
| Income Bracket | # Households | % Households |
| Less than $10,000 | 2,199 | 7.8% |
| $10,000 to $14,999 | 1,607 | 5.7% |
| $15,000 to $24,999 | 2,649 | 9.4% |
| $25,000 to $34,999 | 2,424 | 8.6% |
| $35,000 to $49,999 | 3,833 | 13.6% |
| $50,000 to $74,999 | 4,848 | 17.2% |
| $75,000 to $99,999 | 3,833 | 13.6% |
| $100,000 to $149,999 | 4,284 | 15.2% |
| $150,000 to $199,999 | 1,325 | 4.7% |
| $200,000+ | 1,156 | 4.1% |
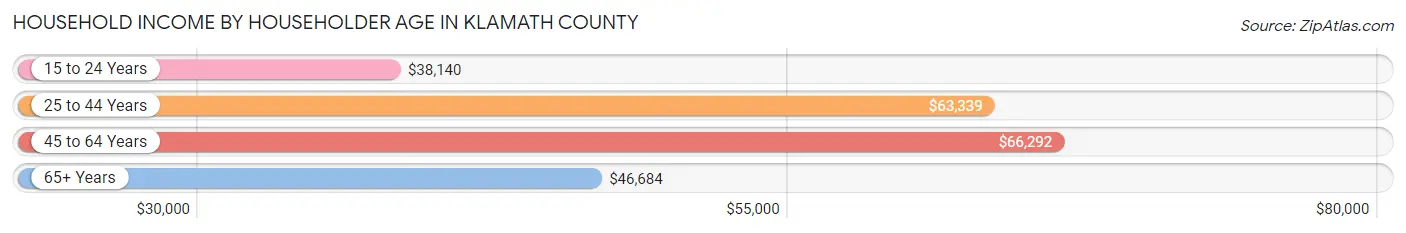
Household Income by Householder Age in Klamath County
The median household income in Klamath County is $57,219, with the highest median household income of $66,292 found in the 45 to 64 years age bracket for the primary householder. A total of 9,752 households (34.6%) fall into this category. Meanwhile, the 15 to 24 years age bracket for the primary householder has the lowest median household income of $38,140, with 1,072 households (3.8%) in this group.
| Income Bracket | # Households | Median Income |
| 15 to 24 Years | 1,072 (3.8%) | $38,140 |
| 25 to 44 Years | 8,026 (28.5%) | $63,339 |
| 45 to 64 Years | 9,752 (34.6%) | $66,292 |
| 65+ Years | 9,336 (33.1%) | $46,684 |
| Total | 28,186 (100.0%) | $57,219 |
Poverty in Klamath County
Income Below Poverty by Sex and Age in Klamath County
With 17.9% poverty level for males and 17.8% for females among the residents of Klamath County, 6 to 11 year old males and 18 to 24 year old females are the most vulnerable to poverty, with 919 males (39.8%) and 739 females (31.5%) in their respective age groups living below the poverty level.
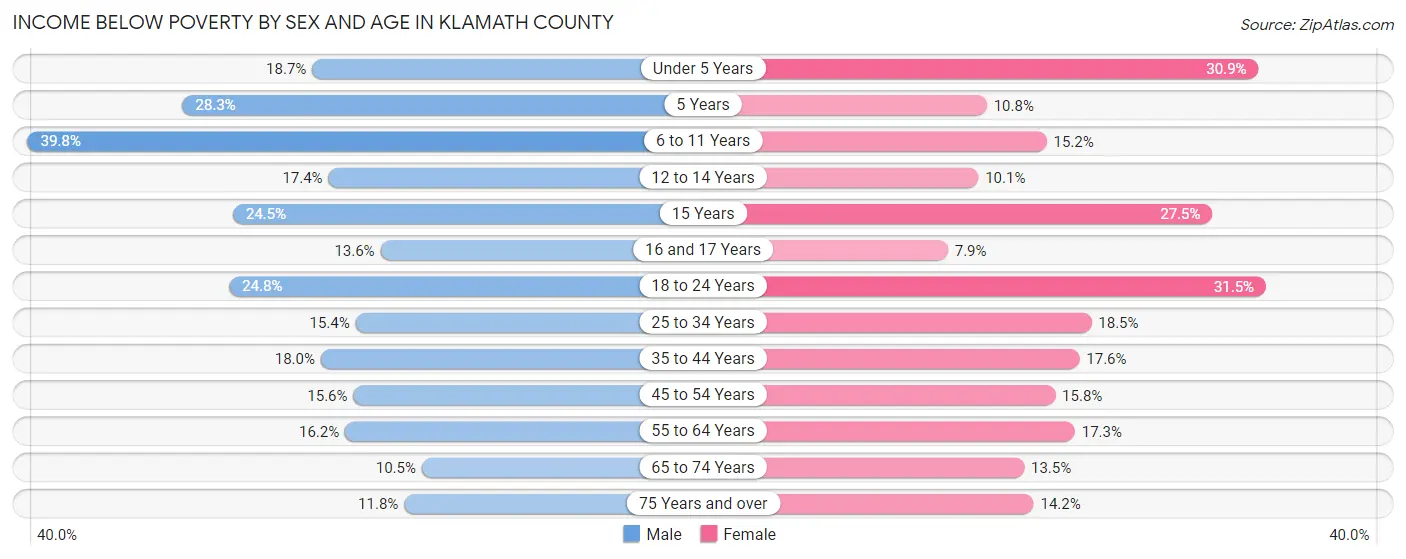
| Age Bracket | Male | Female |
| Under 5 Years | 358 (18.6%) | 584 (30.9%) |
| 5 Years | 151 (28.3%) | 48 (10.8%) |
| 6 to 11 Years | 919 (39.8%) | 393 (15.2%) |
| 12 to 14 Years | 263 (17.4%) | 87 (10.1%) |
| 15 Years | 121 (24.5%) | 126 (27.5%) |
| 16 and 17 Years | 105 (13.6%) | 64 (7.9%) |
| 18 to 24 Years | 719 (24.8%) | 739 (31.5%) |
| 25 to 34 Years | 682 (15.4%) | 839 (18.5%) |
| 35 to 44 Years | 701 (18.0%) | 661 (17.6%) |
| 45 to 54 Years | 623 (15.6%) | 591 (15.8%) |
| 55 to 64 Years | 739 (16.2%) | 844 (17.3%) |
| 65 to 74 Years | 492 (10.5%) | 634 (13.5%) |
| 75 Years and over | 294 (11.8%) | 424 (14.2%) |
| Total | 6,167 (17.9%) | 6,034 (17.8%) |
Income Above Poverty by Sex and Age in Klamath County
According to the poverty statistics in Klamath County, males aged 65 to 74 years and females aged 16 and 17 years are the age groups that are most secure financially, with 89.5% of males and 92.1% of females in these age groups living above the poverty line.
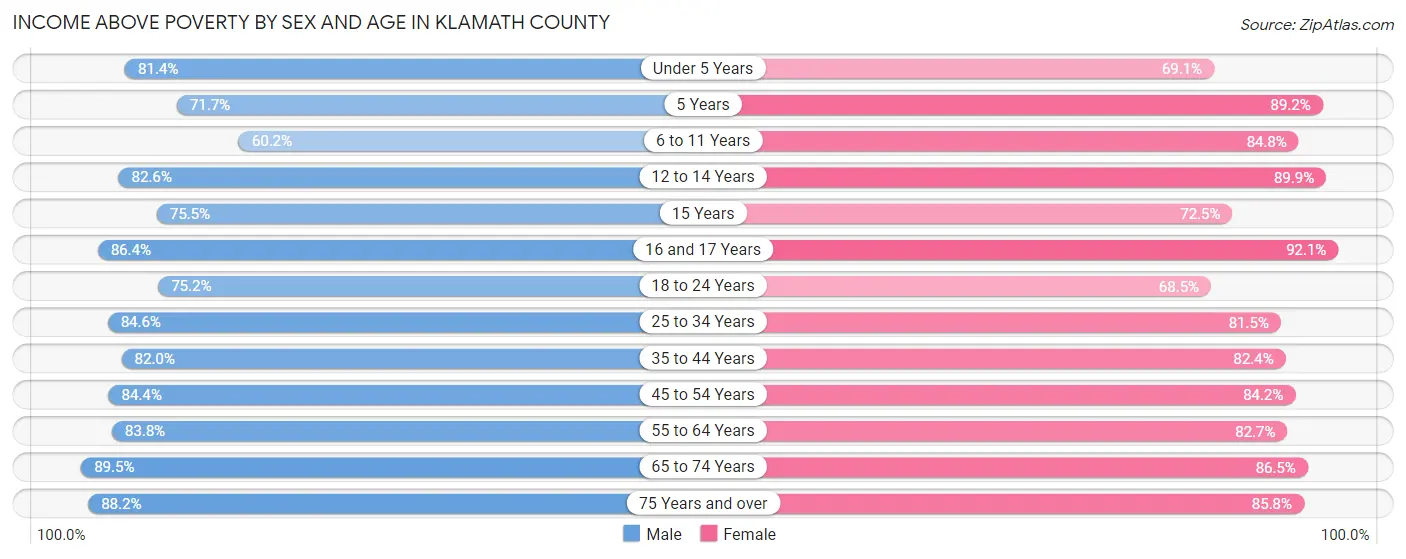
| Age Bracket | Male | Female |
| Under 5 Years | 1,562 (81.4%) | 1,304 (69.1%) |
| 5 Years | 383 (71.7%) | 398 (89.2%) |
| 6 to 11 Years | 1,391 (60.2%) | 2,192 (84.8%) |
| 12 to 14 Years | 1,245 (82.6%) | 772 (89.9%) |
| 15 Years | 372 (75.5%) | 332 (72.5%) |
| 16 and 17 Years | 668 (86.4%) | 749 (92.1%) |
| 18 to 24 Years | 2,179 (75.2%) | 1,608 (68.5%) |
| 25 to 34 Years | 3,738 (84.6%) | 3,689 (81.5%) |
| 35 to 44 Years | 3,192 (82.0%) | 3,086 (82.4%) |
| 45 to 54 Years | 3,372 (84.4%) | 3,139 (84.2%) |
| 55 to 64 Years | 3,820 (83.8%) | 4,036 (82.7%) |
| 65 to 74 Years | 4,188 (89.5%) | 4,053 (86.5%) |
| 75 Years and over | 2,193 (88.2%) | 2,554 (85.8%) |
| Total | 28,303 (82.1%) | 27,912 (82.2%) |
Income Below Poverty Among Married-Couple Families in Klamath County
The poverty statistics for married-couple families in Klamath County show that 7.1% or 905 of the total 12,663 families live below the poverty line. Families with 5 or more children have the highest poverty rate of 65.8%, comprising of 73 families. On the other hand, families with 1 or 2 children have the lowest poverty rate of 5.6%, which includes 188 families.
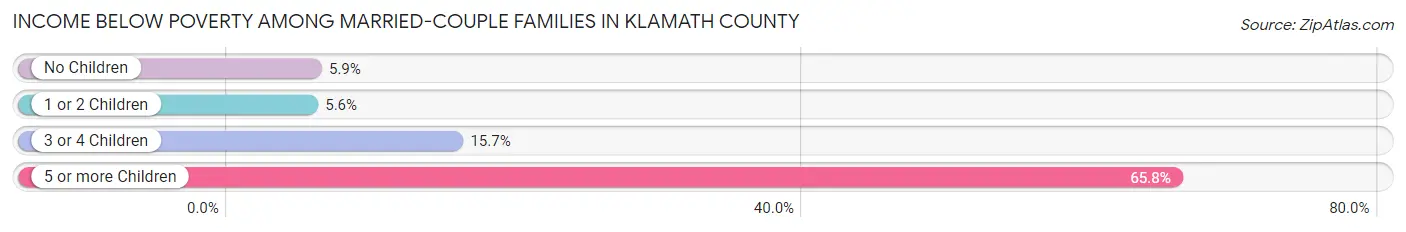
| Children | Above Poverty | Below Poverty |
| No Children | 7,631 (94.2%) | 474 (5.9%) |
| 1 or 2 Children | 3,176 (94.4%) | 188 (5.6%) |
| 3 or 4 Children | 913 (84.3%) | 170 (15.7%) |
| 5 or more Children | 38 (34.2%) | 73 (65.8%) |
| Total | 11,758 (92.8%) | 905 (7.1%) |
Income Below Poverty Among Single-Parent Households in Klamath County
According to the poverty data in Klamath County, 20.1% or 264 single-father households and 27.2% or 859 single-mother households are living below the poverty line. Among single-father households, those with 3 or 4 children have the highest poverty rate, with 49 households (41.9%) experiencing poverty. Likewise, among single-mother households, those with 3 or 4 children have the highest poverty rate, with 227 households (57.8%) falling below the poverty line.
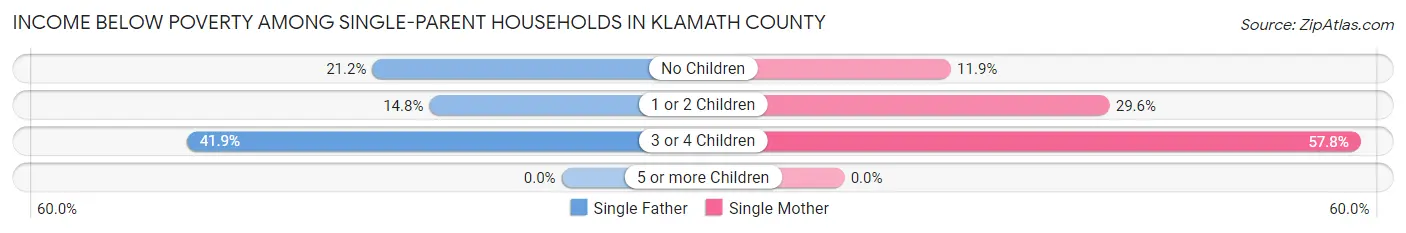
| Children | Single Father | Single Mother |
| No Children | 125 (21.1%) | 125 (11.9%) |
| 1 or 2 Children | 90 (14.8%) | 507 (29.6%) |
| 3 or 4 Children | 49 (41.9%) | 227 (57.8%) |
| 5 or more Children | 0 (0.0%) | 0 (0.0%) |
| Total | 264 (20.1%) | 859 (27.2%) |
Income Below Poverty Among Married-Couple vs Single-Parent Households in Klamath County
The poverty data for Klamath County shows that 905 of the married-couple family households (7.1%) and 1,123 of the single-parent households (25.1%) are living below the poverty level. Within the married-couple family households, those with 5 or more children have the highest poverty rate, with 73 households (65.8%) falling below the poverty line. Among the single-parent households, those with 3 or 4 children have the highest poverty rate, with 276 household (54.1%) living below poverty.
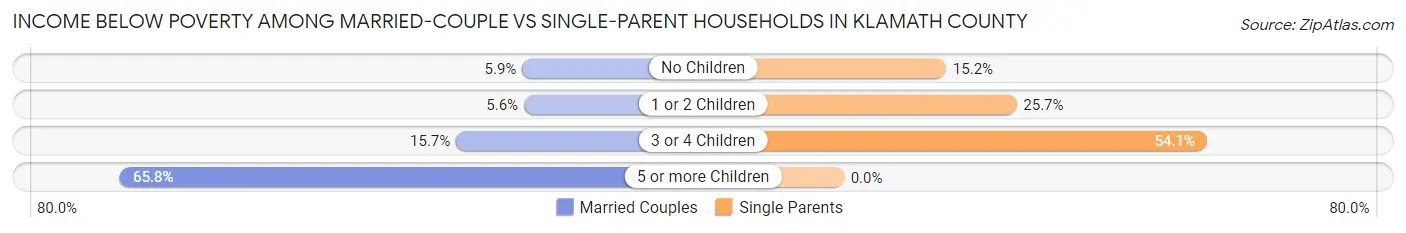
| Children | Married-Couple Families | Single-Parent Households |
| No Children | 474 (5.9%) | 250 (15.2%) |
| 1 or 2 Children | 188 (5.6%) | 597 (25.7%) |
| 3 or 4 Children | 170 (15.7%) | 276 (54.1%) |
| 5 or more Children | 73 (65.8%) | 0 (0.0%) |
| Total | 905 (7.1%) | 1,123 (25.1%) |
Race in Klamath County
The most populous races in Klamath County are White / Caucasian (56,303 | 81.0%), Hispanic or Latino (9,900 | 14.2%), and Two or more Races (6,707 | 9.7%).
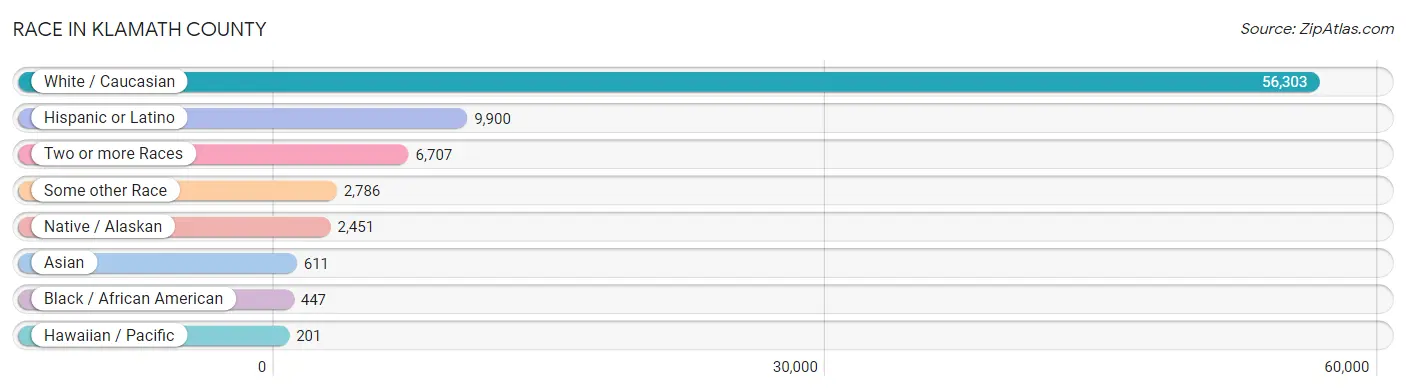
| Race | # Population | % Population |
| Asian | 611 | 0.9% |
| Black / African American | 447 | 0.6% |
| Hawaiian / Pacific | 201 | 0.3% |
| Hispanic or Latino | 9,900 | 14.2% |
| Native / Alaskan | 2,451 | 3.5% |
| White / Caucasian | 56,303 | 81.0% |
| Two or more Races | 6,707 | 9.7% |
| Some other Race | 2,786 | 4.0% |
| Total | 69,506 | 100.0% |
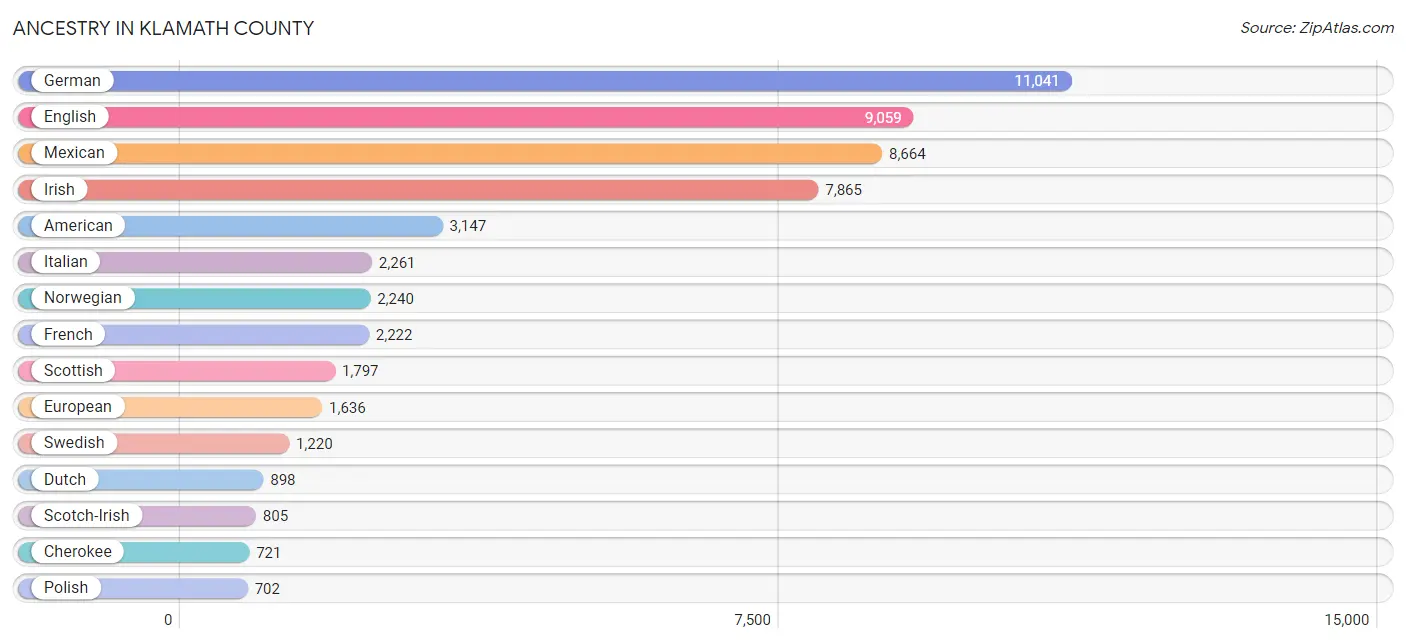
Ancestry in Klamath County
The most populous ancestries reported in Klamath County are German (11,041 | 15.9%), English (9,059 | 13.0%), Mexican (8,664 | 12.5%), Irish (7,865 | 11.3%), and American (3,147 | 4.5%), together accounting for 57.2% of all Klamath County residents.
| Ancestry | # Population | % Population |
| African | 99 | 0.1% |
| Alaska Native | 63 | 0.1% |
| Albanian | 6 | 0.0% |
| Aleut | 20 | 0.0% |
| American | 3,147 | 4.5% |
| Apache | 51 | 0.1% |
| Arab | 29 | 0.0% |
| Arapaho | 29 | 0.0% |
| Argentinean | 4 | 0.0% |
| Armenian | 10 | 0.0% |
| Australian | 56 | 0.1% |
| Austrian | 114 | 0.2% |
| Basque | 237 | 0.3% |
| Belgian | 18 | 0.0% |
| Bhutanese | 165 | 0.2% |
| Blackfeet | 53 | 0.1% |
| British | 662 | 0.9% |
| Burmese | 64 | 0.1% |
| Canadian | 107 | 0.2% |
| Celtic | 17 | 0.0% |
| Central American | 262 | 0.4% |
| Central American Indian | 9 | 0.0% |
| Cherokee | 721 | 1.0% |
| Chickasaw | 89 | 0.1% |
| Chilean | 11 | 0.0% |
| Chippewa | 19 | 0.0% |
| Choctaw | 115 | 0.2% |
| Colombian | 72 | 0.1% |
| Comanche | 13 | 0.0% |
| Costa Rican | 56 | 0.1% |
| Creek | 76 | 0.1% |
| Croatian | 72 | 0.1% |
| Cuban | 12 | 0.0% |
| Czech | 214 | 0.3% |
| Czechoslovakian | 117 | 0.2% |
| Danish | 411 | 0.6% |
| Dutch | 898 | 1.3% |
| Eastern European | 120 | 0.2% |
| Egyptian | 15 | 0.0% |
| English | 9,059 | 13.0% |
| Estonian | 7 | 0.0% |
| Ethiopian | 13 | 0.0% |
| European | 1,636 | 2.4% |
| Fijian | 71 | 0.1% |
| Filipino | 28 | 0.0% |
| Finnish | 234 | 0.3% |
| French | 2,222 | 3.2% |
| French Canadian | 575 | 0.8% |
| German | 11,041 | 15.9% |
| Greek | 135 | 0.2% |
| Guamanian / Chamorro | 7 | 0.0% |
| Guatemalan | 41 | 0.1% |
| Haitian | 24 | 0.0% |
| Honduran | 134 | 0.2% |
| Hungarian | 83 | 0.1% |
| Icelander | 42 | 0.1% |
| Indian (Asian) | 215 | 0.3% |
| Inupiat | 66 | 0.1% |
| Irish | 7,865 | 11.3% |
| Iroquois | 49 | 0.1% |
| Israeli | 121 | 0.2% |
| Italian | 2,261 | 3.3% |
| Jamaican | 105 | 0.2% |
| Korean | 408 | 0.6% |
| Laotian | 201 | 0.3% |
| Latvian | 26 | 0.0% |
| Liberian | 24 | 0.0% |
| Lithuanian | 57 | 0.1% |
| Mexican | 8,664 | 12.5% |
| Mexican American Indian | 119 | 0.2% |
| Native Hawaiian | 190 | 0.3% |
| Navajo | 40 | 0.1% |
| Nigerian | 7 | 0.0% |
| Northern European | 234 | 0.3% |
| Norwegian | 2,240 | 3.2% |
| Osage | 9 | 0.0% |
| Paiute | 15 | 0.0% |
| Panamanian | 8 | 0.0% |
| Pennsylvania German | 17 | 0.0% |
| Peruvian | 41 | 0.1% |
| Pima | 1 | 0.0% |
| Polish | 702 | 1.0% |
| Portuguese | 536 | 0.8% |
| Potawatomi | 24 | 0.0% |
| Pueblo | 2 | 0.0% |
| Puerto Rican | 2 | 0.0% |
| Romanian | 29 | 0.0% |
| Russian | 424 | 0.6% |
| Salvadoran | 23 | 0.0% |
| Samoan | 165 | 0.2% |
| Scandinavian | 360 | 0.5% |
| Scotch-Irish | 805 | 1.2% |
| Scottish | 1,797 | 2.6% |
| Serbian | 2 | 0.0% |
| Shoshone | 90 | 0.1% |
| Sierra Leonean | 2 | 0.0% |
| Sioux | 98 | 0.1% |
| Slovak | 7 | 0.0% |
| Slovene | 25 | 0.0% |
| South African | 11 | 0.0% |
| South American | 128 | 0.2% |
| Spaniard | 283 | 0.4% |
| Spanish | 359 | 0.5% |
| Sri Lankan | 13 | 0.0% |
| Subsaharan African | 132 | 0.2% |
| Swedish | 1,220 | 1.8% |
| Swiss | 281 | 0.4% |
| Thai | 56 | 0.1% |
| Tlingit-Haida | 25 | 0.0% |
| Ukrainian | 104 | 0.2% |
| Ute | 12 | 0.0% |
| Welsh | 658 | 0.9% |
| Yaqui | 40 | 0.1% |
| Yugoslavian | 31 | 0.0% | View All 114 Rows |
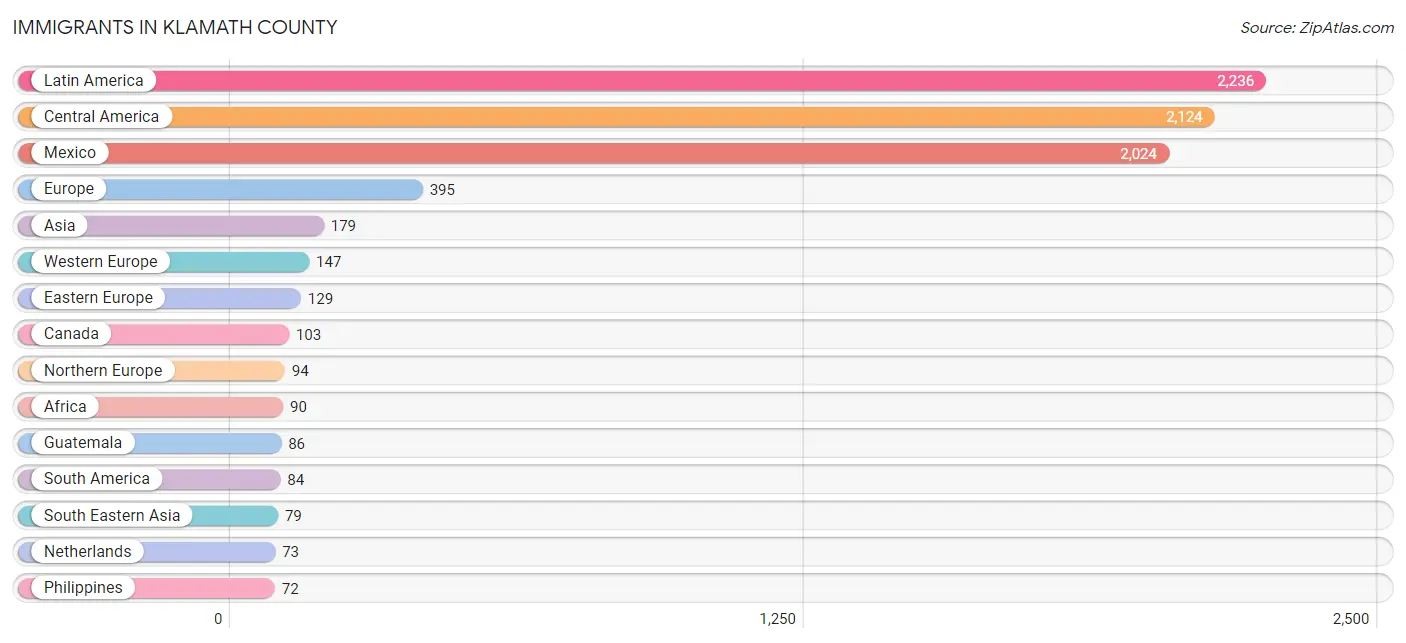
Immigrants in Klamath County
The most numerous immigrant groups reported in Klamath County came from Latin America (2,236 | 3.2%), Central America (2,124 | 3.1%), Mexico (2,024 | 2.9%), Europe (395 | 0.6%), and Asia (179 | 0.3%), together accounting for 10.0% of all Klamath County residents.
| Immigration Origin | # Population | % Population |
| Africa | 90 | 0.1% |
| Asia | 179 | 0.3% |
| Australia | 5 | 0.0% |
| Canada | 103 | 0.2% |
| Caribbean | 28 | 0.0% |
| Central America | 2,124 | 3.1% |
| Chile | 11 | 0.0% |
| China | 59 | 0.1% |
| Colombia | 24 | 0.0% |
| Costa Rica | 13 | 0.0% |
| Cuba | 4 | 0.0% |
| Eastern Africa | 26 | 0.0% |
| Eastern Asia | 59 | 0.1% |
| Eastern Europe | 129 | 0.2% |
| England | 34 | 0.1% |
| Ethiopia | 13 | 0.0% |
| Europe | 395 | 0.6% |
| France | 16 | 0.0% |
| Germany | 58 | 0.1% |
| Guatemala | 86 | 0.1% |
| Haiti | 24 | 0.0% |
| Hungary | 12 | 0.0% |
| India | 25 | 0.0% |
| Ireland | 21 | 0.0% |
| Italy | 18 | 0.0% |
| Kenya | 13 | 0.0% |
| Latin America | 2,236 | 3.2% |
| Latvia | 12 | 0.0% |
| Mexico | 2,024 | 2.9% |
| Moldova | 14 | 0.0% |
| Nepal | 12 | 0.0% |
| Netherlands | 73 | 0.1% |
| Northern Europe | 94 | 0.1% |
| Oceania | 11 | 0.0% |
| Panama | 1 | 0.0% |
| Peru | 41 | 0.1% |
| Philippines | 72 | 0.1% |
| Romania | 5 | 0.0% |
| Russia | 20 | 0.0% |
| Saudi Arabia | 4 | 0.0% |
| Sierra Leone | 2 | 0.0% |
| South Africa | 62 | 0.1% |
| South America | 84 | 0.1% |
| South Central Asia | 37 | 0.1% |
| South Eastern Asia | 79 | 0.1% |
| Southern Europe | 25 | 0.0% |
| Taiwan | 23 | 0.0% |
| Ukraine | 19 | 0.0% |
| Venezuela | 8 | 0.0% |
| Vietnam | 7 | 0.0% |
| Western Africa | 2 | 0.0% |
| Western Asia | 4 | 0.0% |
| Western Europe | 147 | 0.2% | View All 53 Rows |
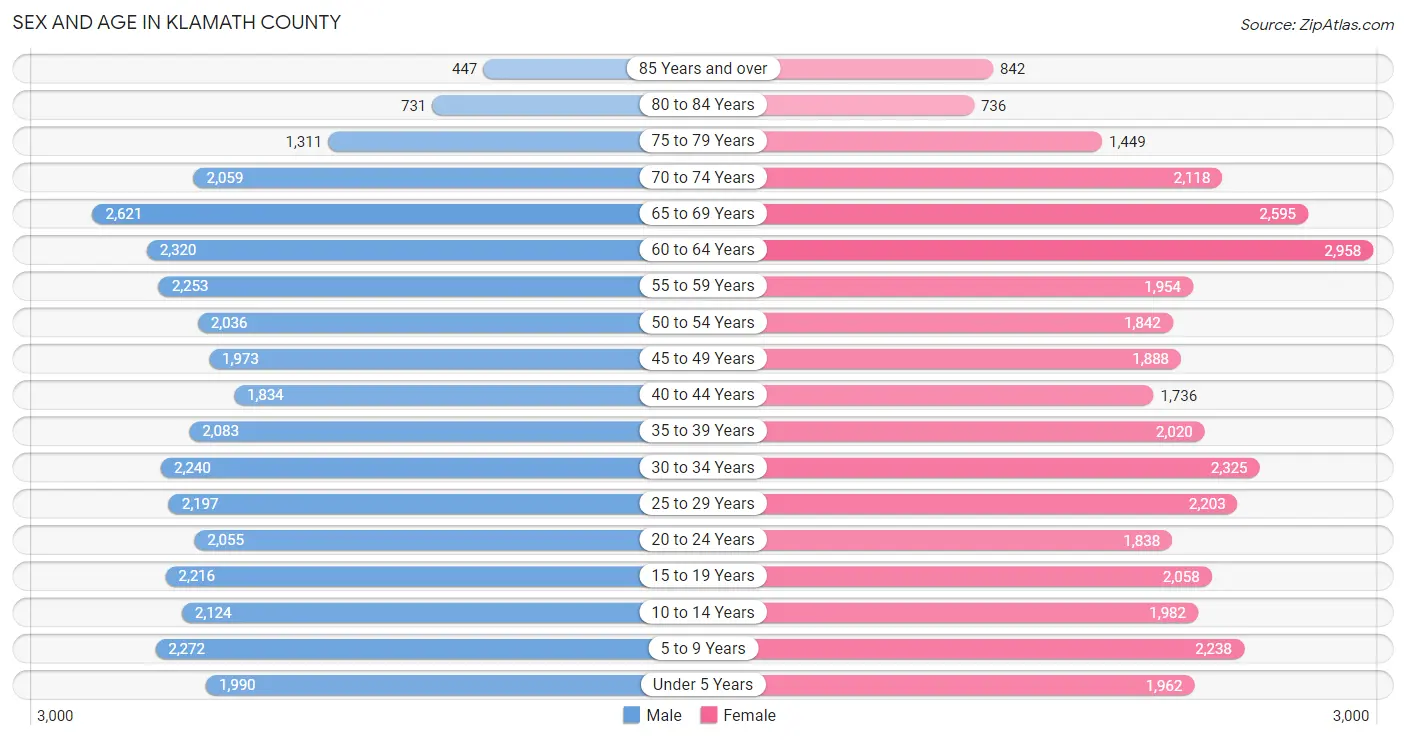
Sex and Age in Klamath County
Sex and Age in Klamath County
The most populous age groups in Klamath County are 65 to 69 Years (2,621 | 7.5%) for men and 60 to 64 Years (2,958 | 8.5%) for women.
| Age Bracket | Male | Female |
| Under 5 Years | 1,990 (5.7%) | 1,962 (5.7%) |
| 5 to 9 Years | 2,272 (6.5%) | 2,238 (6.4%) |
| 10 to 14 Years | 2,124 (6.1%) | 1,982 (5.7%) |
| 15 to 19 Years | 2,216 (6.4%) | 2,058 (5.9%) |
| 20 to 24 Years | 2,055 (5.9%) | 1,838 (5.3%) |
| 25 to 29 Years | 2,197 (6.3%) | 2,203 (6.3%) |
| 30 to 34 Years | 2,240 (6.4%) | 2,325 (6.7%) |
| 35 to 39 Years | 2,083 (6.0%) | 2,020 (5.8%) |
| 40 to 44 Years | 1,834 (5.3%) | 1,736 (5.0%) |
| 45 to 49 Years | 1,973 (5.7%) | 1,888 (5.4%) |
| 50 to 54 Years | 2,036 (5.9%) | 1,842 (5.3%) |
| 55 to 59 Years | 2,253 (6.5%) | 1,954 (5.6%) |
| 60 to 64 Years | 2,320 (6.7%) | 2,958 (8.5%) |
| 65 to 69 Years | 2,621 (7.5%) | 2,595 (7.5%) |
| 70 to 74 Years | 2,059 (5.9%) | 2,118 (6.1%) |
| 75 to 79 Years | 1,311 (3.8%) | 1,449 (4.2%) |
| 80 to 84 Years | 731 (2.1%) | 736 (2.1%) |
| 85 Years and over | 447 (1.3%) | 842 (2.4%) |
| Total | 34,762 (100.0%) | 34,744 (100.0%) |
Families and Households in Klamath County
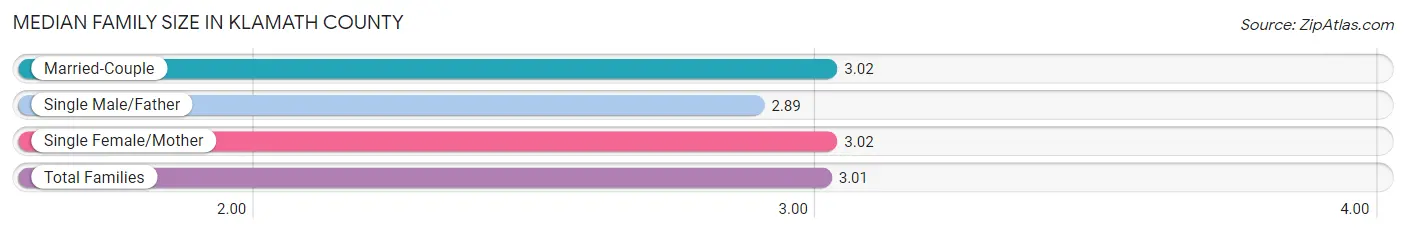
Median Family Size in Klamath County
The median family size in Klamath County is 3.01 persons per family, with married-couple families (12,663 | 73.9%) accounting for the largest median family size of 3.02 persons per family. On the other hand, single male/father families (1,317 | 7.7%) represent the smallest median family size with 2.89 persons per family.
| Family Type | # Families | Family Size |
| Married-Couple | 12,663 (73.9%) | 3.02 |
| Single Male/Father | 1,317 (7.7%) | 2.89 |
| Single Female/Mother | 3,154 (18.4%) | 3.02 |
| Total Families | 17,134 (100.0%) | 3.01 |
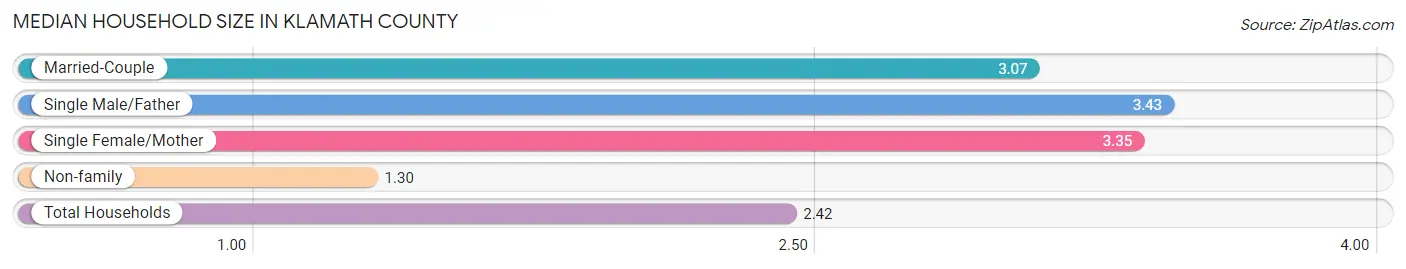
Median Household Size in Klamath County
The median household size in Klamath County is 2.42 persons per household, with single male/father households (1,317 | 4.7%) accounting for the largest median household size of 3.43 persons per household. non-family households (11,052 | 39.2%) represent the smallest median household size with 1.30 persons per household.
| Household Type | # Households | Household Size |
| Married-Couple | 12,663 (44.9%) | 3.07 |
| Single Male/Father | 1,317 (4.7%) | 3.43 |
| Single Female/Mother | 3,154 (11.2%) | 3.35 |
| Non-family | 11,052 (39.2%) | 1.30 |
| Total Households | 28,186 (100.0%) | 2.42 |
Household Size by Marriage Status in Klamath County
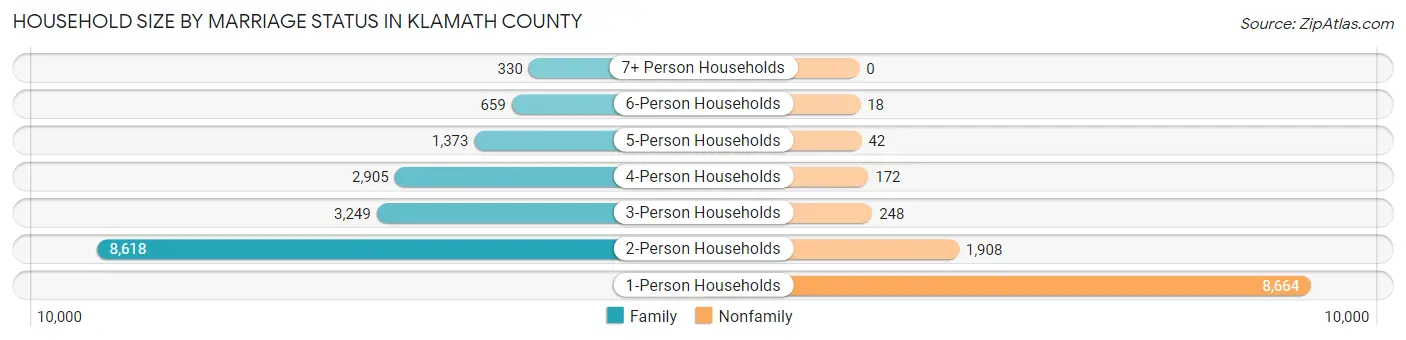
Out of a total of 28,186 households in Klamath County, 17,134 (60.8%) are family households, while 11,052 (39.2%) are nonfamily households. The most numerous type of family households are 2-person households, comprising 8,618, and the most common type of nonfamily households are 1-person households, comprising 8,664.
| Household Size | Family Households | Nonfamily Households |
| 1-Person Households | - | 8,664 (30.7%) |
| 2-Person Households | 8,618 (30.6%) | 1,908 (6.8%) |
| 3-Person Households | 3,249 (11.5%) | 248 (0.9%) |
| 4-Person Households | 2,905 (10.3%) | 172 (0.6%) |
| 5-Person Households | 1,373 (4.9%) | 42 (0.2%) |
| 6-Person Households | 659 (2.3%) | 18 (0.1%) |
| 7+ Person Households | 330 (1.2%) | 0 (0.0%) |
| Total | 17,134 (60.8%) | 11,052 (39.2%) |
Female Fertility in Klamath County
Fertility by Age in Klamath County
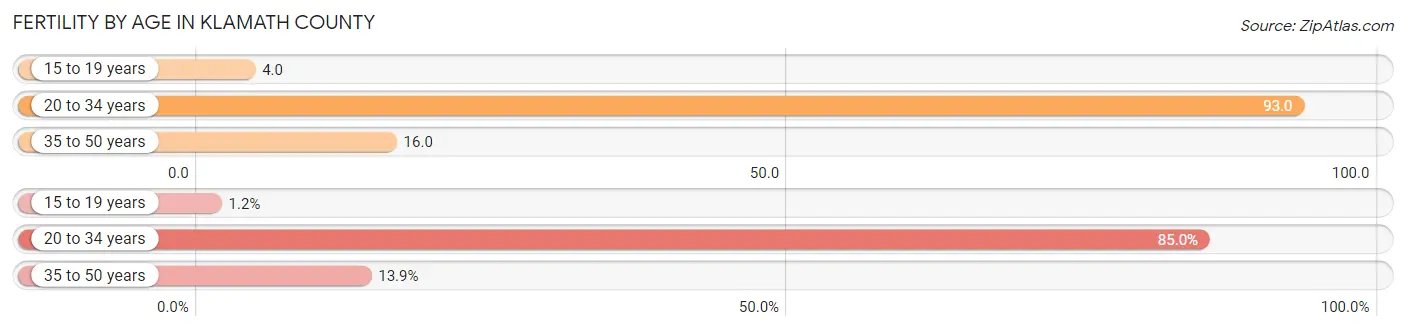
Average fertility rate in Klamath County is 48.0 births per 1,000 women. Women in the age bracket of 20 to 34 years have the highest fertility rate with 93.0 births per 1,000 women. Women in the age bracket of 20 to 34 years acount for 85.0% of all women with births.
| Age Bracket | Women with Births | Births / 1,000 Women |
| 15 to 19 years | 8 (1.1%) | 4.0 |
| 20 to 34 years | 589 (85.0%) | 93.0 |
| 35 to 50 years | 96 (13.9%) | 16.0 |
| Total | 693 (100.0%) | 48.0 |
Fertility by Age by Marriage Status in Klamath County
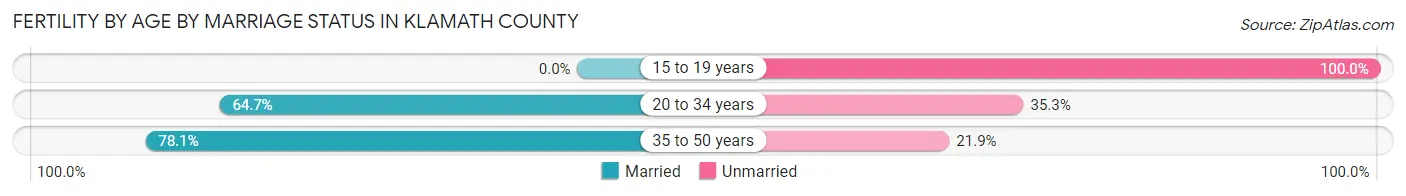
65.8% of women with births (693) in Klamath County are married. The highest percentage of unmarried women with births falls into 15 to 19 years age bracket with 100.0% of them unmarried at the time of birth, while the lowest percentage of unmarried women with births belong to 35 to 50 years age bracket with 21.9% of them unmarried.
| Age Bracket | Married | Unmarried |
| 15 to 19 years | 0 (0.0%) | 8 (100.0%) |
| 20 to 34 years | 381 (64.7%) | 208 (35.3%) |
| 35 to 50 years | 75 (78.1%) | 21 (21.9%) |
| Total | 456 (65.8%) | 237 (34.2%) |
Fertility by Education in Klamath County
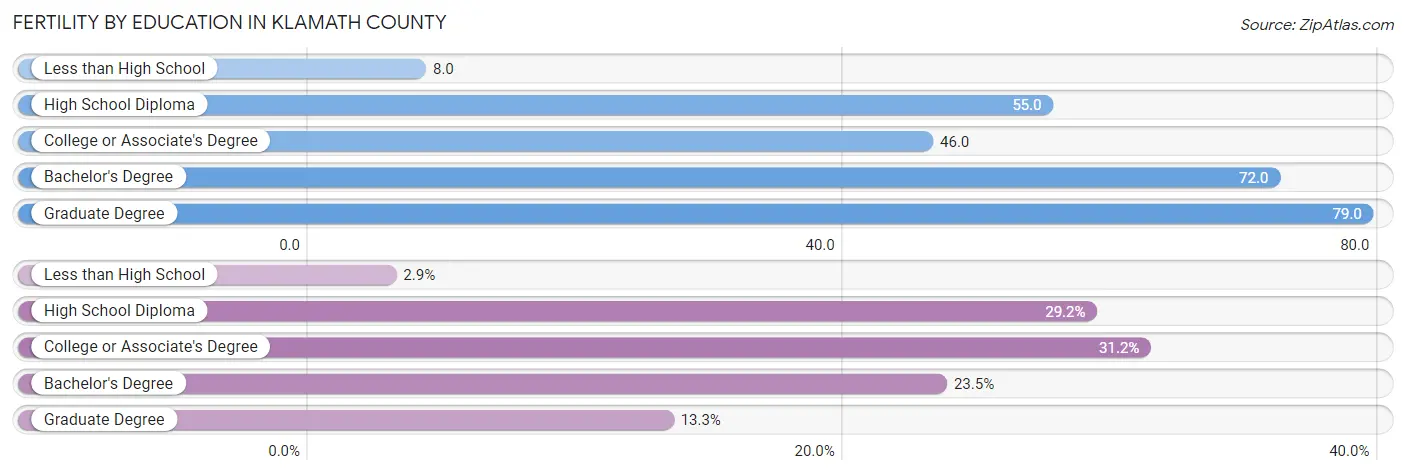
Average fertility rate in Klamath County is 48.0 births per 1,000 women. Women with the education attainment of graduate degree have the highest fertility rate of 79.0 births per 1,000 women, while women with the education attainment of less than high school have the lowest fertility at 8.0 births per 1,000 women. Women with the education attainment of college or associate's degree represent 31.2% of all women with births.
| Educational Attainment | Women with Births | Births / 1,000 Women |
| Less than High School | 20 (2.9%) | 8.0 |
| High School Diploma | 202 (29.1%) | 55.0 |
| College or Associate's Degree | 216 (31.2%) | 46.0 |
| Bachelor's Degree | 163 (23.5%) | 72.0 |
| Graduate Degree | 92 (13.3%) | 79.0 |
| Total | 693 (100.0%) | 48.0 |
Fertility by Education by Marriage Status in Klamath County
34.2% of women with births in Klamath County are unmarried. Women with the educational attainment of graduate degree are most likely to be married with 100.0% of them married at childbirth, while women with the educational attainment of less than high school are least likely to be married with 100.0% of them unmarried at childbirth.
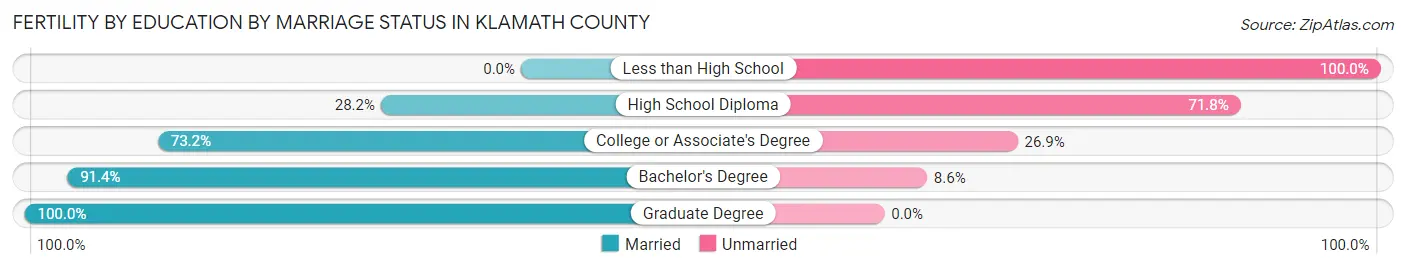
| Educational Attainment | Married | Unmarried |
| Less than High School | 0 (0.0%) | 20 (100.0%) |
| High School Diploma | 57 (28.2%) | 145 (71.8%) |
| College or Associate's Degree | 158 (73.2%) | 58 (26.9%) |
| Bachelor's Degree | 149 (91.4%) | 14 (8.6%) |
| Graduate Degree | 92 (100.0%) | 0 (0.0%) |
| Total | 456 (65.8%) | 237 (34.2%) |
Employment Characteristics in Klamath County
Employment by Class of Employer in Klamath County
Among the 26,823 employed individuals in Klamath County, private company employees (16,229 | 60.5%), local government employees (2,682 | 10.0%), and not-for-profit organizations (2,576 | 9.6%) make up the most common classes of employment.
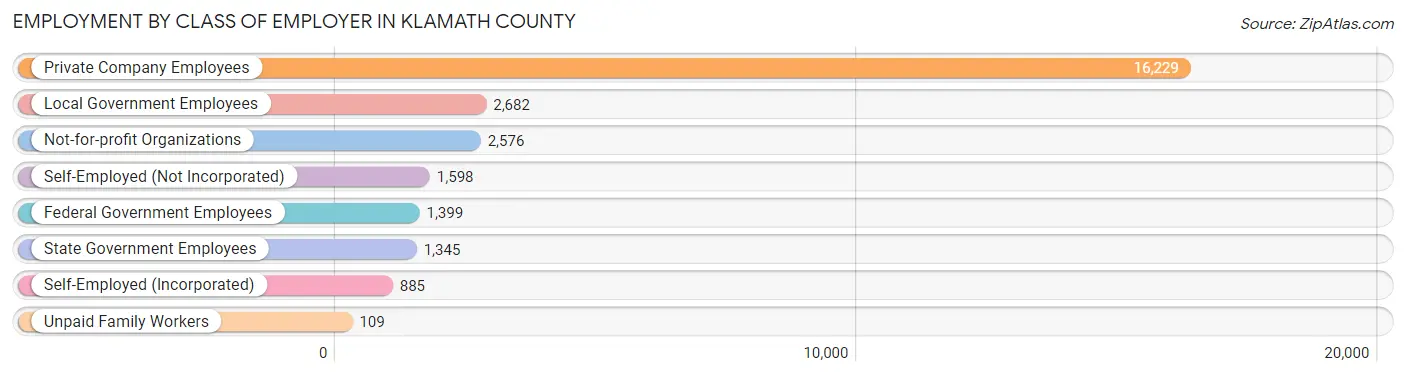
| Employer Class | # Employees | % Employees |
| Private Company Employees | 16,229 | 60.5% |
| Self-Employed (Incorporated) | 885 | 3.3% |
| Self-Employed (Not Incorporated) | 1,598 | 6.0% |
| Not-for-profit Organizations | 2,576 | 9.6% |
| Local Government Employees | 2,682 | 10.0% |
| State Government Employees | 1,345 | 5.0% |
| Federal Government Employees | 1,399 | 5.2% |
| Unpaid Family Workers | 109 | 0.4% |
| Total | 26,823 | 100.0% |
Employment Status by Age in Klamath County
According to the labor force statistics for Klamath County, out of the total population over 16 years of age (55,985), 52.5% or 29,392 individuals are in the labor force, with 7.6% or 2,234 of them unemployed. The age group with the highest labor force participation rate is 30 to 34 years, with 79.4% or 3,625 individuals in the labor force. Within the labor force, the 16 to 19 years age range has the highest percentage of unemployed individuals, with 22.3% or 258 of them being unemployed.
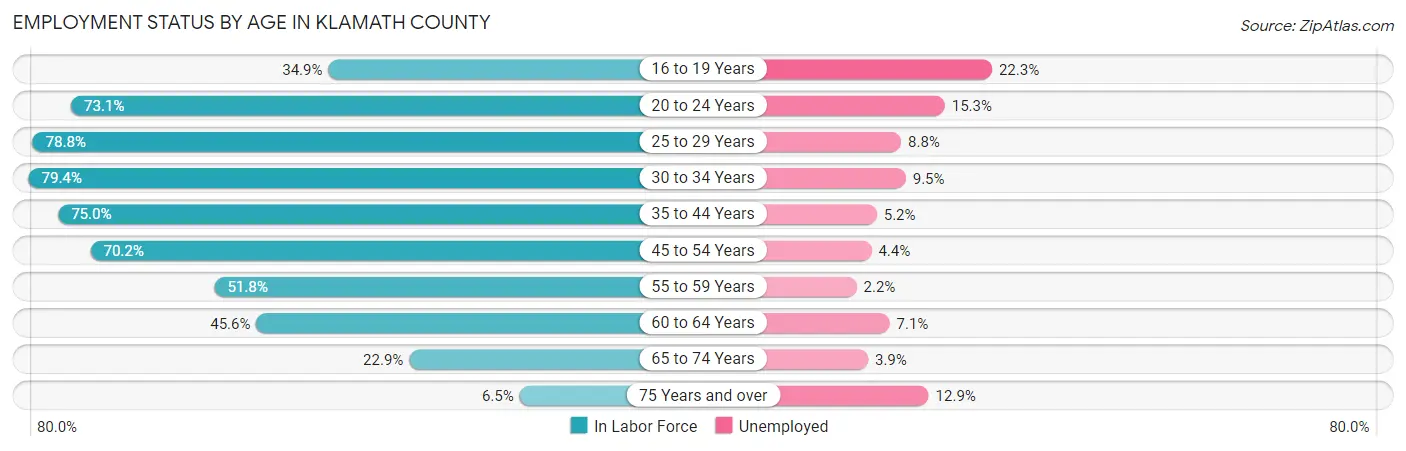
| Age Bracket | In Labor Force | Unemployed |
| 16 to 19 Years | 1,159 (34.9%) | 258 (22.3%) |
| 20 to 24 Years | 2,846 (73.1%) | 435 (15.3%) |
| 25 to 29 Years | 3,467 (78.8%) | 305 (8.8%) |
| 30 to 34 Years | 3,625 (79.4%) | 344 (9.5%) |
| 35 to 44 Years | 5,755 (75.0%) | 299 (5.2%) |
| 45 to 54 Years | 5,433 (70.2%) | 239 (4.4%) |
| 55 to 59 Years | 2,179 (51.8%) | 48 (2.2%) |
| 60 to 64 Years | 2,407 (45.6%) | 171 (7.1%) |
| 65 to 74 Years | 2,151 (22.9%) | 84 (3.9%) |
| 75 Years and over | 359 (6.5%) | 46 (12.9%) |
| Total | 29,392 (52.5%) | 2,234 (7.6%) |
Employment Status by Educational Attainment in Klamath County
According to labor force statistics for Klamath County, 67.5% of individuals (22,857) out of the total population between 25 and 64 years of age (33,862) are in the labor force, with 6.1% or 1,394 of them being unemployed. The group with the highest labor force participation rate are those with the educational attainment of bachelor's degree or higher, with 78.5% or 5,764 individuals in the labor force. Within the labor force, individuals with less than high school education have the highest percentage of unemployment, with 15.6% or 261 of them being unemployed.
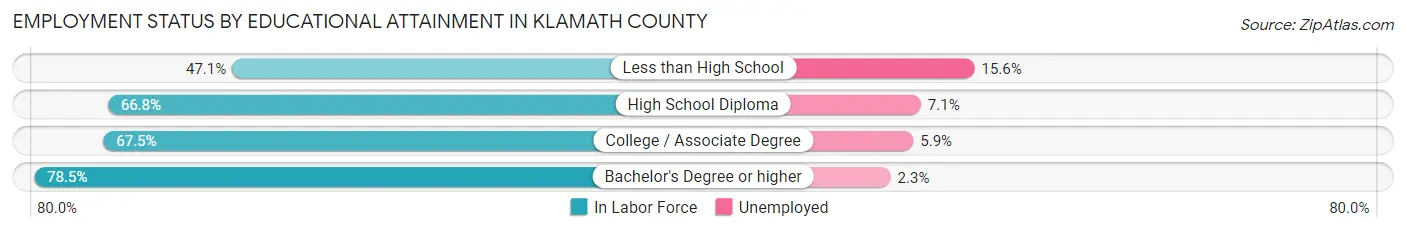
| Educational Attainment | In Labor Force | Unemployed |
| Less than High School | 1,674 (47.1%) | 554 (15.6%) |
| High School Diploma | 7,430 (66.8%) | 790 (7.1%) |
| College / Associate Degree | 7,993 (67.5%) | 699 (5.9%) |
| Bachelor's Degree or higher | 5,764 (78.5%) | 169 (2.3%) |
| Total | 22,857 (67.5%) | 2,066 (6.1%) |
Employment Occupations by Sex in Klamath County
Management, Business, Science and Arts Occupations
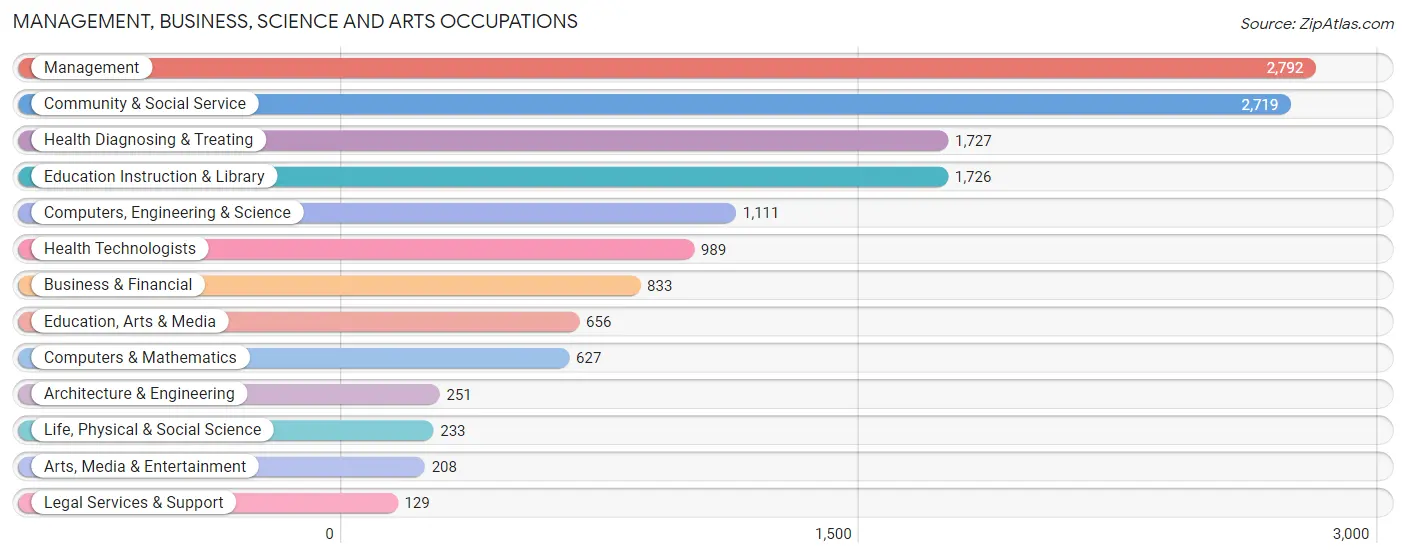
The most common Management, Business, Science and Arts occupations in Klamath County are Management (2,792 | 10.5%), Community & Social Service (2,719 | 10.2%), Health Diagnosing & Treating (1,727 | 6.5%), Education Instruction & Library (1,726 | 6.5%), and Computers, Engineering & Science (1,111 | 4.2%).
Management, Business, Science and Arts Occupations by Sex
Within the Management, Business, Science and Arts occupations in Klamath County, the most male-oriented occupations are Architecture & Engineering (79.7%), Life, Physical & Social Science (73.0%), and Arts, Media & Entertainment (66.8%), while the most female-oriented occupations are Legal Services & Support (85.3%), Health Diagnosing & Treating (78.3%), and Health Technologists (73.2%).
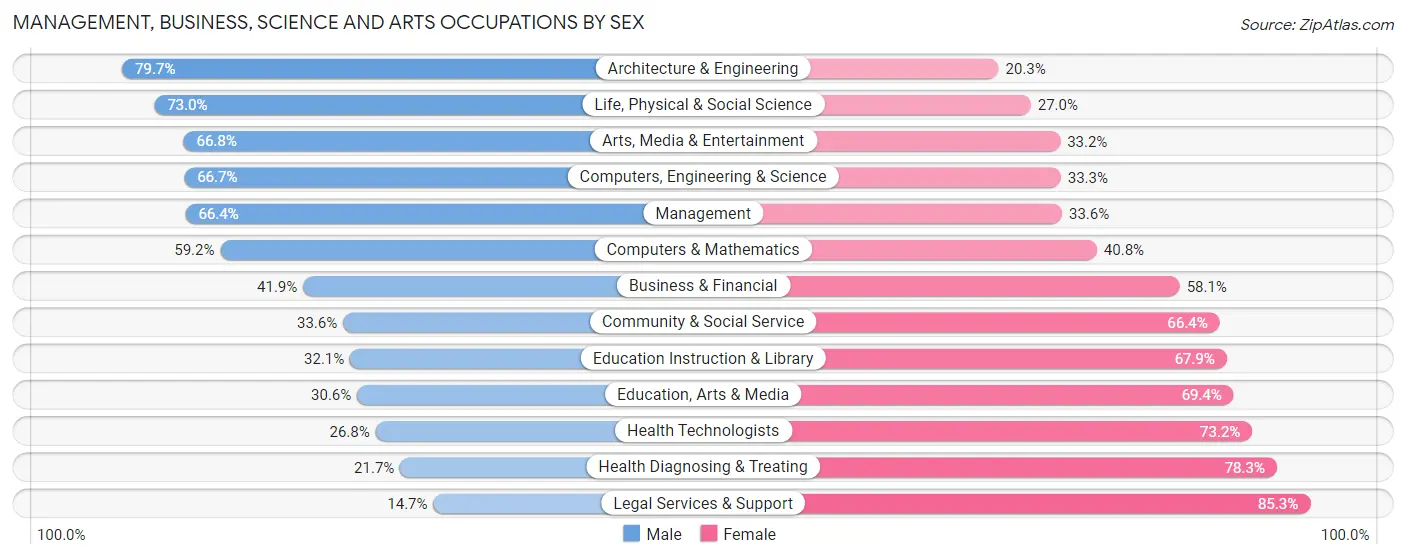
| Occupation | Male | Female |
| Management | 1,855 (66.4%) | 937 (33.6%) |
| Business & Financial | 349 (41.9%) | 484 (58.1%) |
| Computers, Engineering & Science | 741 (66.7%) | 370 (33.3%) |
| Computers & Mathematics | 371 (59.2%) | 256 (40.8%) |
| Architecture & Engineering | 200 (79.7%) | 51 (20.3%) |
| Life, Physical & Social Science | 170 (73.0%) | 63 (27.0%) |
| Community & Social Service | 913 (33.6%) | 1,806 (66.4%) |
| Education, Arts & Media | 201 (30.6%) | 455 (69.4%) |
| Legal Services & Support | 19 (14.7%) | 110 (85.3%) |
| Education Instruction & Library | 554 (32.1%) | 1,172 (67.9%) |
| Arts, Media & Entertainment | 139 (66.8%) | 69 (33.2%) |
| Health Diagnosing & Treating | 374 (21.7%) | 1,353 (78.3%) |
| Health Technologists | 265 (26.8%) | 724 (73.2%) |
| Total (Category) | 4,232 (46.1%) | 4,950 (53.9%) |
| Total (Overall) | 13,861 (52.2%) | 12,672 (47.8%) |
Services Occupations
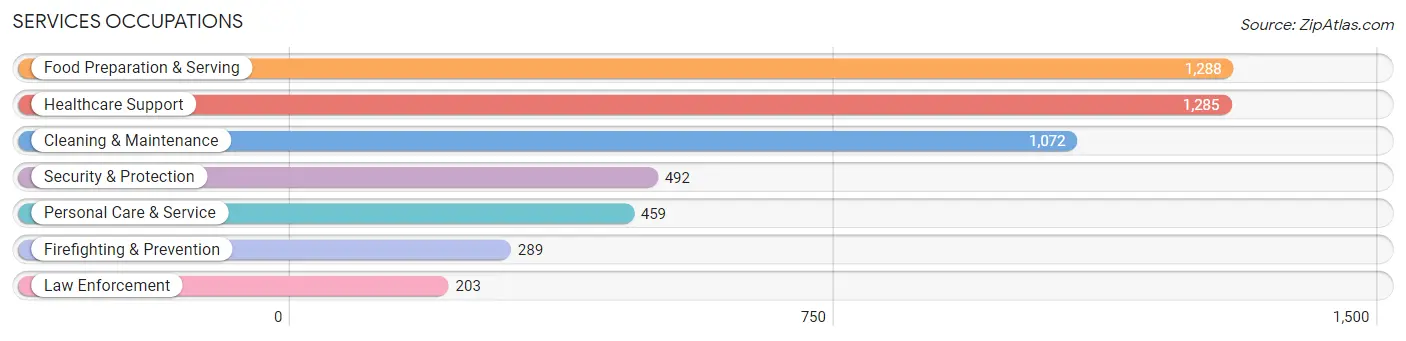
The most common Services occupations in Klamath County are Food Preparation & Serving (1,288 | 4.9%), Healthcare Support (1,285 | 4.8%), Cleaning & Maintenance (1,072 | 4.0%), Security & Protection (492 | 1.8%), and Personal Care & Service (459 | 1.7%).
Services Occupations by Sex
Within the Services occupations in Klamath County, the most male-oriented occupations are Law Enforcement (90.1%), Security & Protection (68.3%), and Cleaning & Maintenance (60.1%), while the most female-oriented occupations are Healthcare Support (78.5%), Personal Care & Service (76.5%), and Food Preparation & Serving (61.7%).
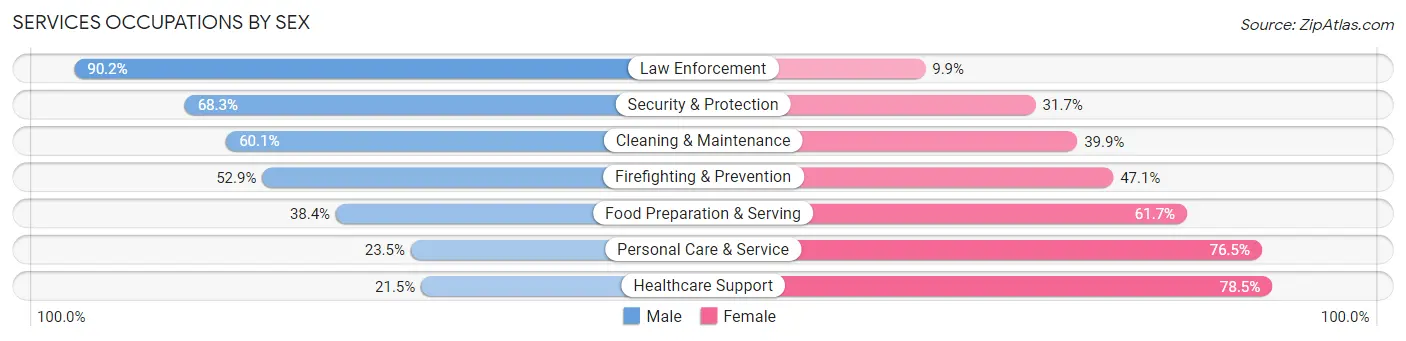
| Occupation | Male | Female |
| Healthcare Support | 276 (21.5%) | 1,009 (78.5%) |
| Security & Protection | 336 (68.3%) | 156 (31.7%) |
| Firefighting & Prevention | 153 (52.9%) | 136 (47.1%) |
| Law Enforcement | 183 (90.1%) | 20 (9.9%) |
| Food Preparation & Serving | 494 (38.4%) | 794 (61.7%) |
| Cleaning & Maintenance | 644 (60.1%) | 428 (39.9%) |
| Personal Care & Service | 108 (23.5%) | 351 (76.5%) |
| Total (Category) | 1,858 (40.4%) | 2,738 (59.6%) |
| Total (Overall) | 13,861 (52.2%) | 12,672 (47.8%) |
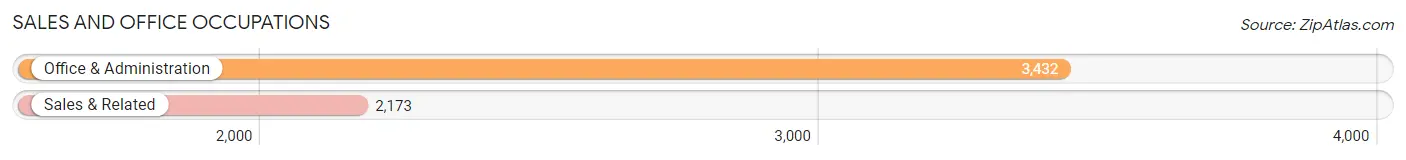
Sales and Office Occupations
The most common Sales and Office occupations in Klamath County are Office & Administration (3,432 | 12.9%), and Sales & Related (2,173 | 8.2%).
Sales and Office Occupations by Sex
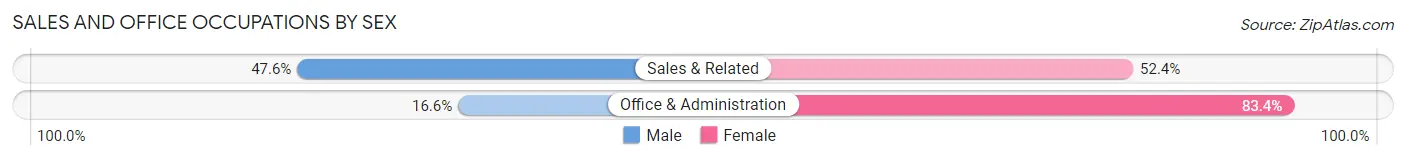
| Occupation | Male | Female |
| Sales & Related | 1,034 (47.6%) | 1,139 (52.4%) |
| Office & Administration | 571 (16.6%) | 2,861 (83.4%) |
| Total (Category) | 1,605 (28.6%) | 4,000 (71.4%) |
| Total (Overall) | 13,861 (52.2%) | 12,672 (47.8%) |
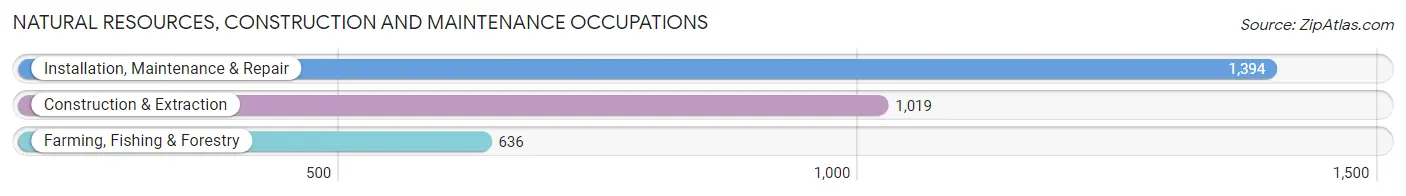
Natural Resources, Construction and Maintenance Occupations
The most common Natural Resources, Construction and Maintenance occupations in Klamath County are Installation, Maintenance & Repair (1,394 | 5.2%), Construction & Extraction (1,019 | 3.8%), and Farming, Fishing & Forestry (636 | 2.4%).
Natural Resources, Construction and Maintenance Occupations by Sex
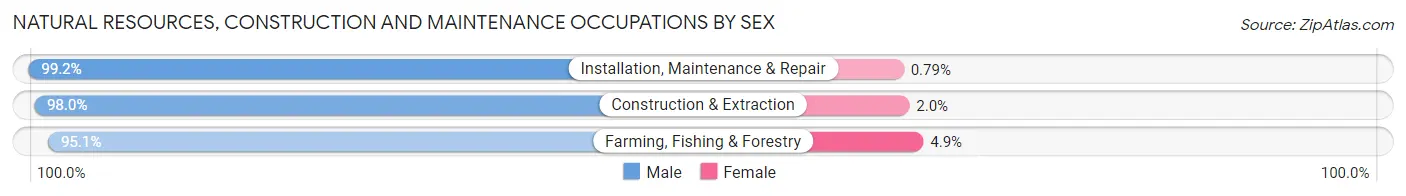
| Occupation | Male | Female |
| Farming, Fishing & Forestry | 605 (95.1%) | 31 (4.9%) |
| Construction & Extraction | 999 (98.0%) | 20 (2.0%) |
| Installation, Maintenance & Repair | 1,383 (99.2%) | 11 (0.8%) |
| Total (Category) | 2,987 (98.0%) | 62 (2.0%) |
| Total (Overall) | 13,861 (52.2%) | 12,672 (47.8%) |
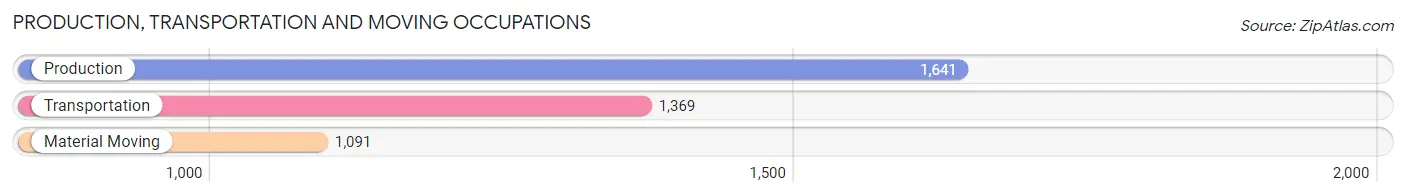
Production, Transportation and Moving Occupations
The most common Production, Transportation and Moving occupations in Klamath County are Production (1,641 | 6.2%), Transportation (1,369 | 5.2%), and Material Moving (1,091 | 4.1%).
Production, Transportation and Moving Occupations by Sex
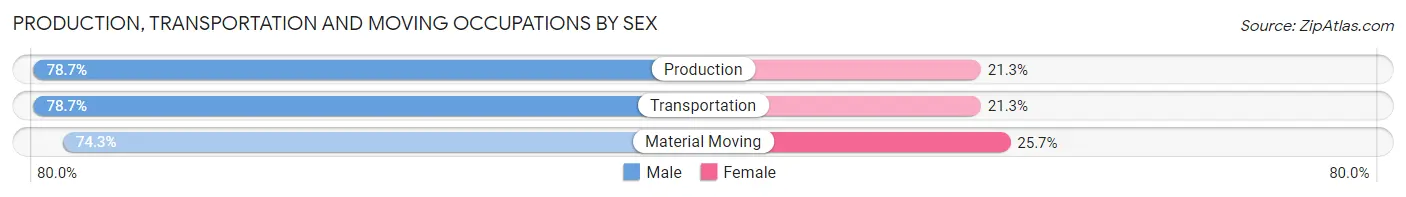
| Occupation | Male | Female |
| Production | 1,291 (78.7%) | 350 (21.3%) |
| Transportation | 1,077 (78.7%) | 292 (21.3%) |
| Material Moving | 811 (74.3%) | 280 (25.7%) |
| Total (Category) | 3,179 (77.5%) | 922 (22.5%) |
| Total (Overall) | 13,861 (52.2%) | 12,672 (47.8%) |
Employment Industries by Sex in Klamath County
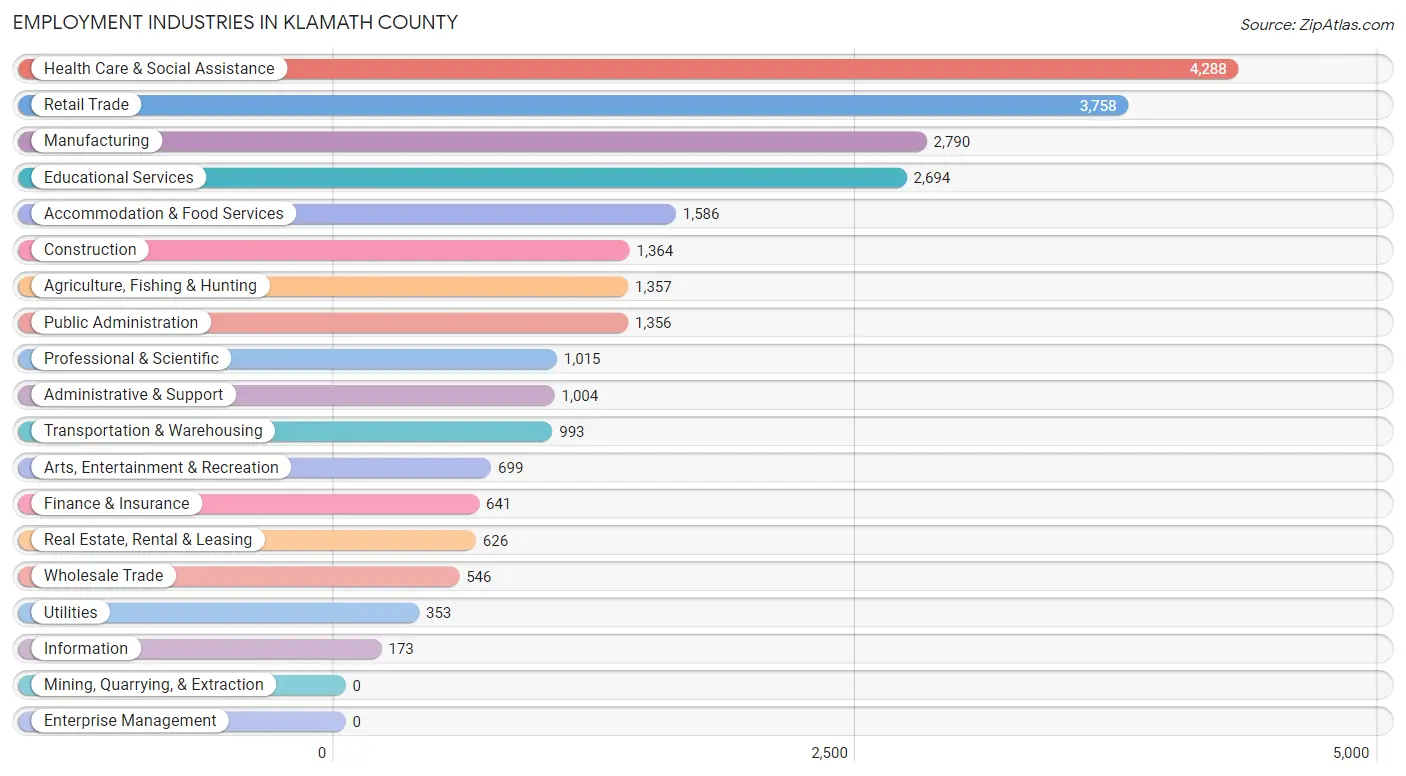
Employment Industries in Klamath County
The major employment industries in Klamath County include Health Care & Social Assistance (4,288 | 16.2%), Retail Trade (3,758 | 14.2%), Manufacturing (2,790 | 10.5%), Educational Services (2,694 | 10.2%), and Accommodation & Food Services (1,586 | 6.0%).
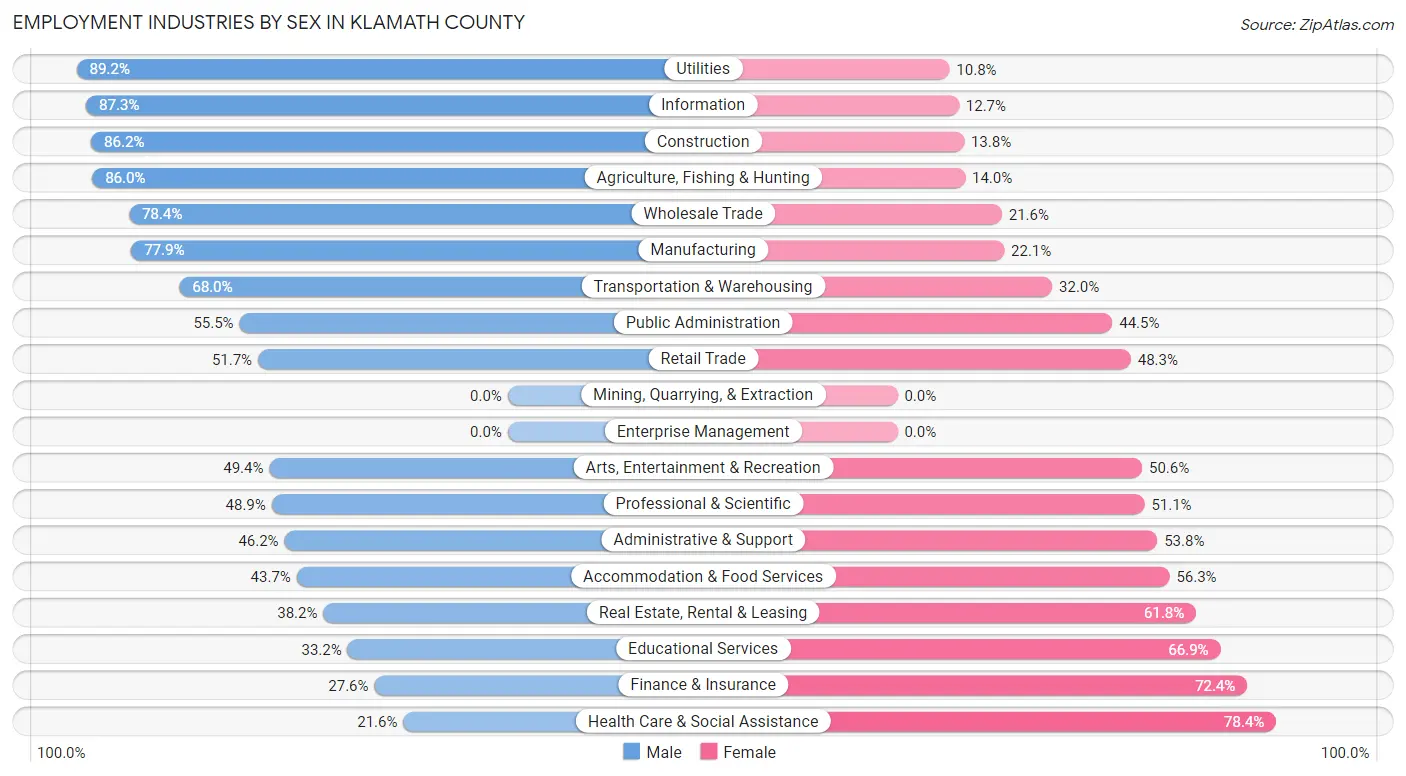
Employment Industries by Sex in Klamath County
The Klamath County industries that see more men than women are Utilities (89.2%), Information (87.3%), and Construction (86.2%), whereas the industries that tend to have a higher number of women are Health Care & Social Assistance (78.4%), Finance & Insurance (72.4%), and Educational Services (66.8%).
| Industry | Male | Female |
| Agriculture, Fishing & Hunting | 1,167 (86.0%) | 190 (14.0%) |
| Mining, Quarrying, & Extraction | 0 (0.0%) | 0 (0.0%) |
| Construction | 1,176 (86.2%) | 188 (13.8%) |
| Manufacturing | 2,174 (77.9%) | 616 (22.1%) |
| Wholesale Trade | 428 (78.4%) | 118 (21.6%) |
| Retail Trade | 1,943 (51.7%) | 1,815 (48.3%) |
| Transportation & Warehousing | 675 (68.0%) | 318 (32.0%) |
| Utilities | 315 (89.2%) | 38 (10.8%) |
| Information | 151 (87.3%) | 22 (12.7%) |
| Finance & Insurance | 177 (27.6%) | 464 (72.4%) |
| Real Estate, Rental & Leasing | 239 (38.2%) | 387 (61.8%) |
| Professional & Scientific | 496 (48.9%) | 519 (51.1%) |
| Enterprise Management | 0 (0.0%) | 0 (0.0%) |
| Administrative & Support | 464 (46.2%) | 540 (53.8%) |
| Educational Services | 893 (33.2%) | 1,801 (66.8%) |
| Health Care & Social Assistance | 927 (21.6%) | 3,361 (78.4%) |
| Arts, Entertainment & Recreation | 345 (49.4%) | 354 (50.6%) |
| Accommodation & Food Services | 693 (43.7%) | 893 (56.3%) |
| Public Administration | 753 (55.5%) | 603 (44.5%) |
| Total | 13,861 (52.2%) | 12,672 (47.8%) |
Education in Klamath County
School Enrollment in Klamath County
The most common levels of schooling among the 15,311 students in Klamath County are college / undergraduate (3,354 | 21.9%), elementary school (3,329 | 21.7%), and high school (3,187 | 20.8%).
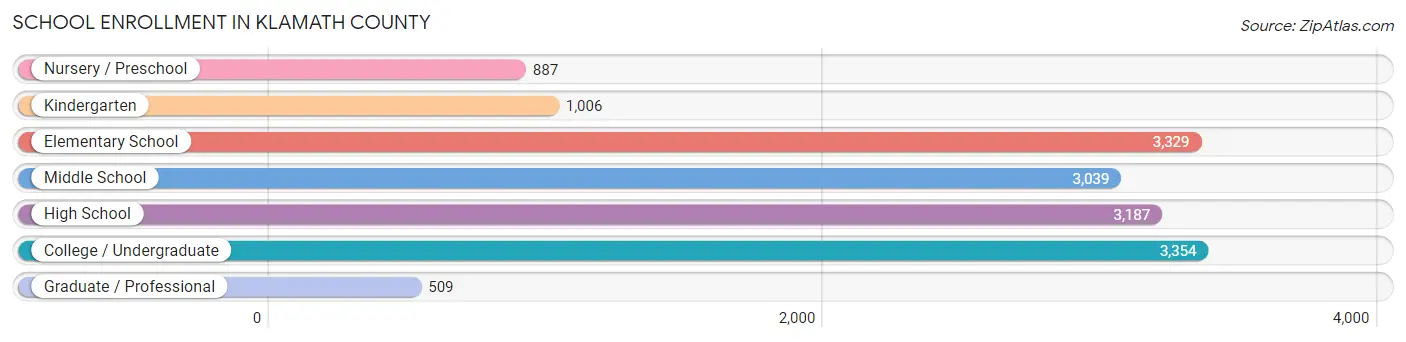
| School Level | # Students | % Students |
| Nursery / Preschool | 887 | 5.8% |
| Kindergarten | 1,006 | 6.6% |
| Elementary School | 3,329 | 21.7% |
| Middle School | 3,039 | 19.9% |
| High School | 3,187 | 20.8% |
| College / Undergraduate | 3,354 | 21.9% |
| Graduate / Professional | 509 | 3.3% |
| Total | 15,311 | 100.0% |
School Enrollment by Age by Funding Source in Klamath County
Out of a total of 15,311 students who are enrolled in schools in Klamath County, 2,052 (13.4%) attend a private institution, while the remaining 13,259 (86.6%) are enrolled in public schools. The age group of 3 to 4 year olds has the highest likelihood of being enrolled in private schools, with 249 (35.7% in the age bracket) enrolled. Conversely, the age group of 15 to 17 year olds has the lowest likelihood of being enrolled in a private school, with 2,170 (92.6% in the age bracket) attending a public institution.
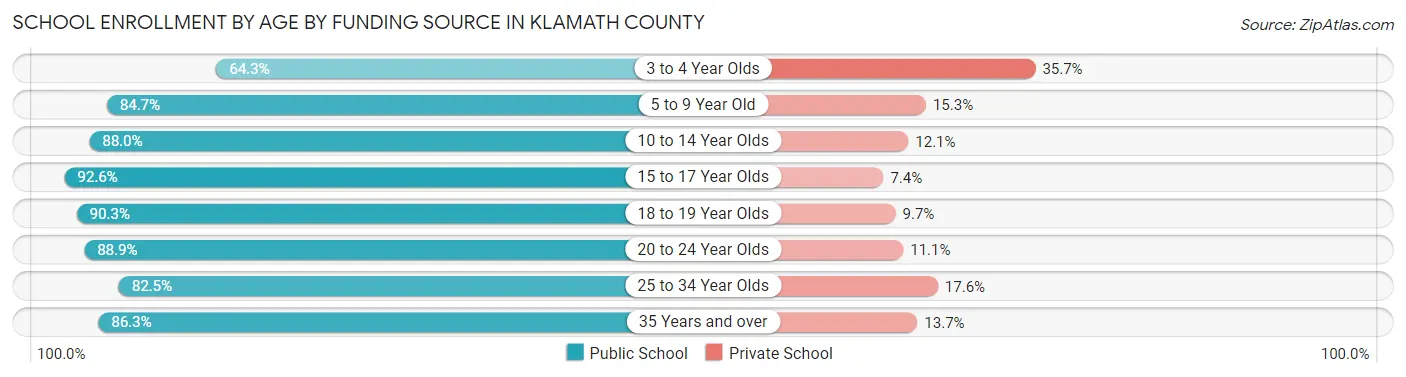
| Age Bracket | Public School | Private School |
| 3 to 4 Year Olds | 448 (64.3%) | 249 (35.7%) |
| 5 to 9 Year Old | 3,352 (84.7%) | 607 (15.3%) |
| 10 to 14 Year Olds | 3,488 (87.9%) | 478 (12.0%) |
| 15 to 17 Year Olds | 2,170 (92.6%) | 174 (7.4%) |
| 18 to 19 Year Olds | 1,148 (90.3%) | 123 (9.7%) |
| 20 to 24 Year Olds | 1,104 (88.9%) | 138 (11.1%) |
| 25 to 34 Year Olds | 808 (82.5%) | 172 (17.5%) |
| 35 Years and over | 735 (86.3%) | 117 (13.7%) |
| Total | 13,259 (86.6%) | 2,052 (13.4%) |
Educational Attainment by Field of Study in Klamath County
Business (1,640 | 14.9%), education (1,582 | 14.4%), science & technology (1,504 | 13.7%), bio, nature & agricultural (1,385 | 12.6%), and psychology (781 | 7.1%) are the most common fields of study among 11,018 individuals in Klamath County who have obtained a bachelor's degree or higher.
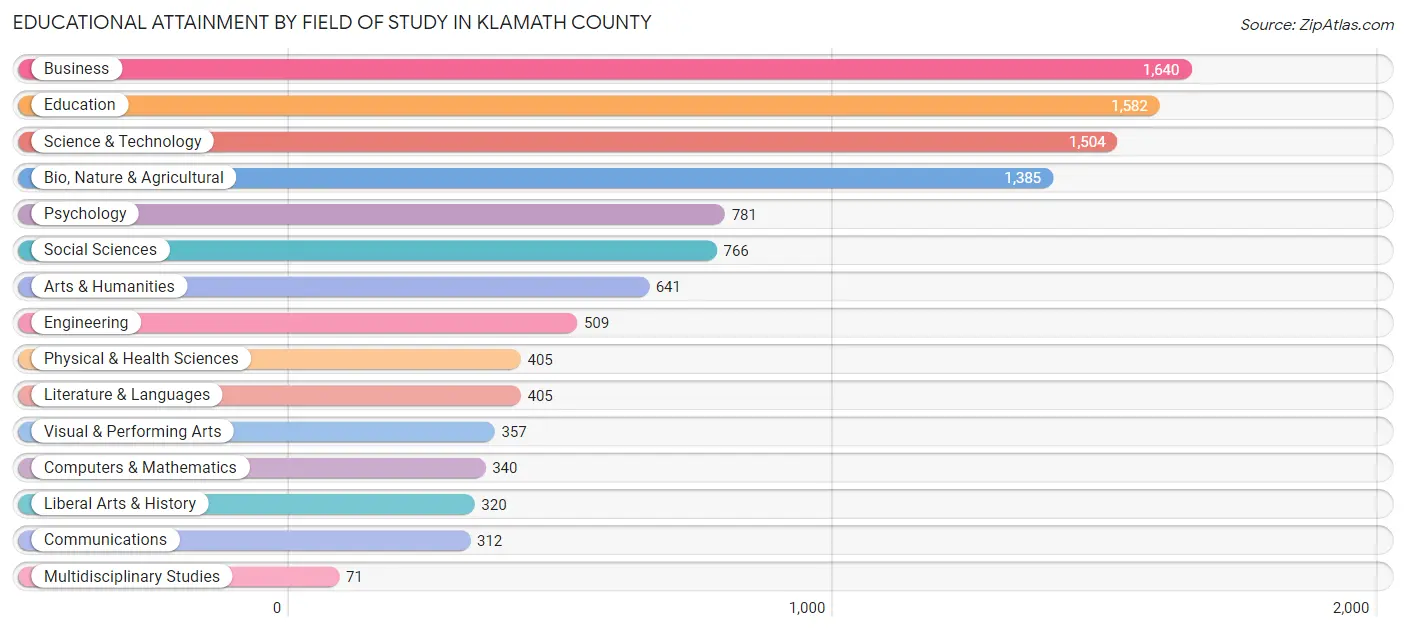
| Field of Study | # Graduates | % Graduates |
| Computers & Mathematics | 340 | 3.1% |
| Bio, Nature & Agricultural | 1,385 | 12.6% |
| Physical & Health Sciences | 405 | 3.7% |
| Psychology | 781 | 7.1% |
| Social Sciences | 766 | 7.0% |
| Engineering | 509 | 4.6% |
| Multidisciplinary Studies | 71 | 0.6% |
| Science & Technology | 1,504 | 13.7% |
| Business | 1,640 | 14.9% |
| Education | 1,582 | 14.4% |
| Literature & Languages | 405 | 3.7% |
| Liberal Arts & History | 320 | 2.9% |
| Visual & Performing Arts | 357 | 3.2% |
| Communications | 312 | 2.8% |
| Arts & Humanities | 641 | 5.8% |
| Total | 11,018 | 100.0% |
Transportation & Commute in Klamath County
Vehicle Availability by Sex in Klamath County
The most prevalent vehicle ownership categories in Klamath County are males with 2 vehicles (5,473, accounting for 38.9%) and females with 2 vehicles (4,640, making up 44.2%).
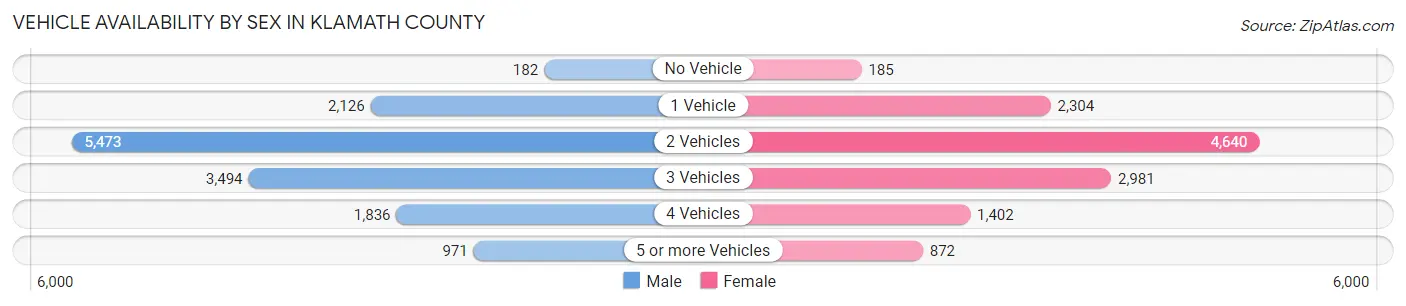
| Vehicles Available | Male | Female |
| No Vehicle | 182 (1.3%) | 185 (1.5%) |
| 1 Vehicle | 2,126 (15.1%) | 2,304 (18.6%) |
| 2 Vehicles | 5,473 (38.9%) | 4,640 (37.5%) |
| 3 Vehicles | 3,494 (24.8%) | 2,981 (24.1%) |
| 4 Vehicles | 1,836 (13.0%) | 1,402 (11.3%) |
| 5 or more Vehicles | 971 (6.9%) | 872 (7.0%) |
| Total | 14,082 (100.0%) | 12,384 (100.0%) |
Commute Time in Klamath County
The most frequently occuring commute durations in Klamath County are 10 to 14 minutes (5,784 commuters, 23.2%), 15 to 19 minutes (5,140 commuters, 20.6%), and 5 to 9 minutes (5,060 commuters, 20.3%).
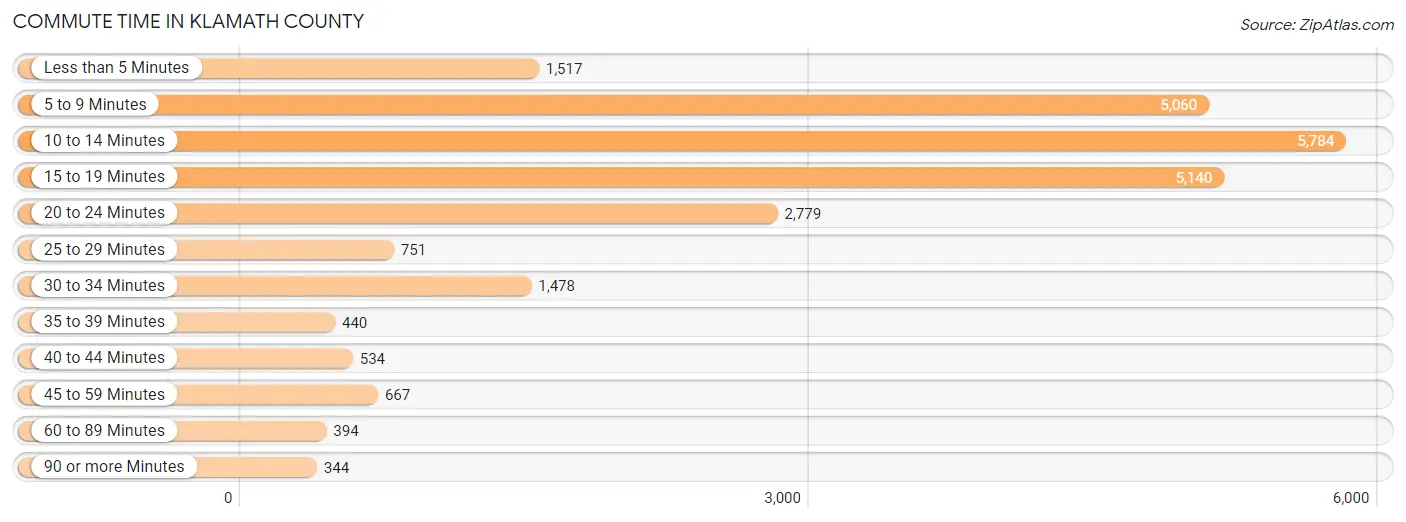
| Commute Time | # Commuters | % Commuters |
| Less than 5 Minutes | 1,517 | 6.1% |
| 5 to 9 Minutes | 5,060 | 20.3% |
| 10 to 14 Minutes | 5,784 | 23.2% |
| 15 to 19 Minutes | 5,140 | 20.6% |
| 20 to 24 Minutes | 2,779 | 11.2% |
| 25 to 29 Minutes | 751 | 3.0% |
| 30 to 34 Minutes | 1,478 | 5.9% |
| 35 to 39 Minutes | 440 | 1.8% |
| 40 to 44 Minutes | 534 | 2.1% |
| 45 to 59 Minutes | 667 | 2.7% |
| 60 to 89 Minutes | 394 | 1.6% |
| 90 or more Minutes | 344 | 1.4% |
Commute Time by Sex in Klamath County
The most common commute times in Klamath County are 15 to 19 minutes (2,796 commuters, 21.0%) for males and 10 to 14 minutes (3,039 commuters, 26.3%) for females.
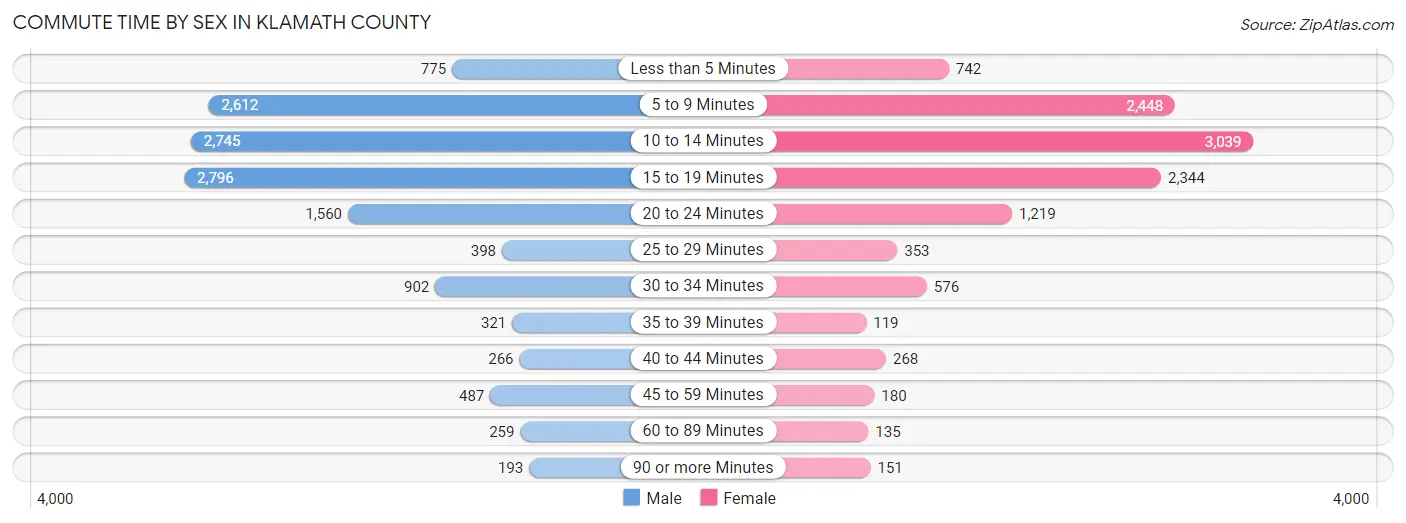
| Commute Time | Male | Female |
| Less than 5 Minutes | 775 (5.8%) | 742 (6.4%) |
| 5 to 9 Minutes | 2,612 (19.6%) | 2,448 (21.1%) |
| 10 to 14 Minutes | 2,745 (20.6%) | 3,039 (26.3%) |
| 15 to 19 Minutes | 2,796 (21.0%) | 2,344 (20.3%) |
| 20 to 24 Minutes | 1,560 (11.7%) | 1,219 (10.5%) |
| 25 to 29 Minutes | 398 (3.0%) | 353 (3.0%) |
| 30 to 34 Minutes | 902 (6.8%) | 576 (5.0%) |
| 35 to 39 Minutes | 321 (2.4%) | 119 (1.0%) |
| 40 to 44 Minutes | 266 (2.0%) | 268 (2.3%) |
| 45 to 59 Minutes | 487 (3.7%) | 180 (1.6%) |
| 60 to 89 Minutes | 259 (1.9%) | 135 (1.2%) |
| 90 or more Minutes | 193 (1.5%) | 151 (1.3%) |
Time of Departure to Work by Sex in Klamath County
The most frequent times of departure to work in Klamath County are 7:30 AM to 7:59 AM (1,551, 11.7%) for males and 7:30 AM to 7:59 AM (2,564, 22.2%) for females.
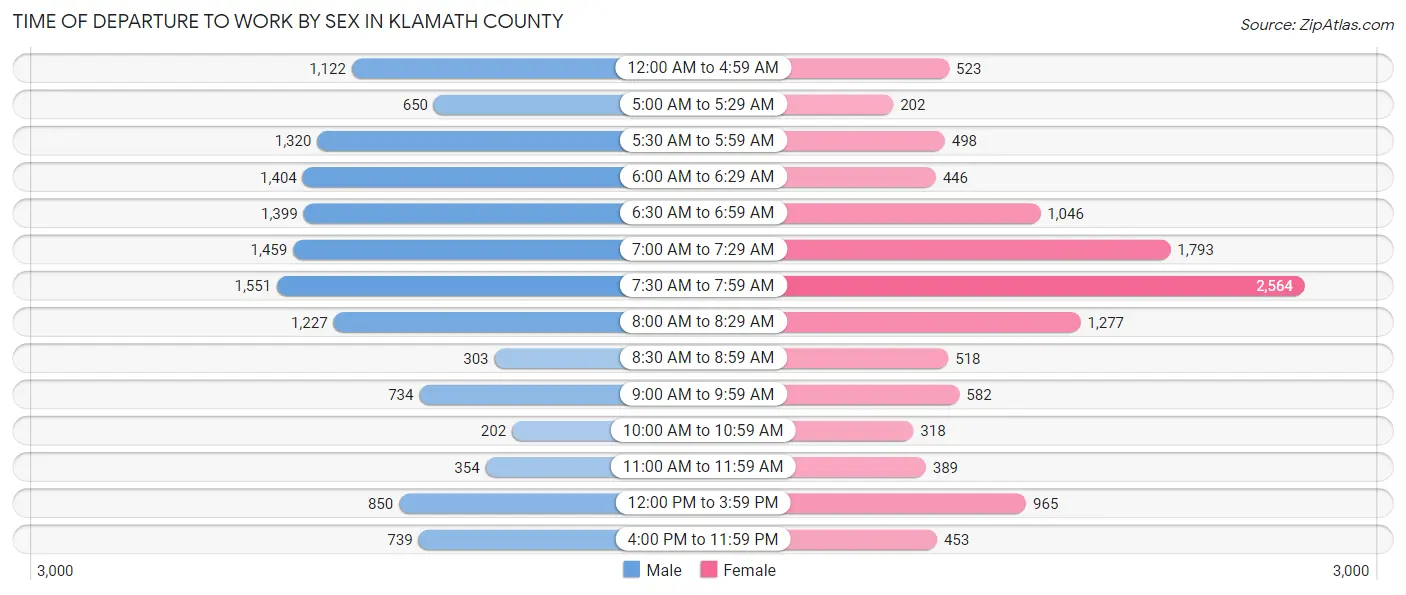
| Time of Departure | Male | Female |
| 12:00 AM to 4:59 AM | 1,122 (8.4%) | 523 (4.5%) |
| 5:00 AM to 5:29 AM | 650 (4.9%) | 202 (1.8%) |
| 5:30 AM to 5:59 AM | 1,320 (9.9%) | 498 (4.3%) |
| 6:00 AM to 6:29 AM | 1,404 (10.5%) | 446 (3.8%) |
| 6:30 AM to 6:59 AM | 1,399 (10.5%) | 1,046 (9.0%) |
| 7:00 AM to 7:29 AM | 1,459 (11.0%) | 1,793 (15.5%) |
| 7:30 AM to 7:59 AM | 1,551 (11.7%) | 2,564 (22.2%) |
| 8:00 AM to 8:29 AM | 1,227 (9.2%) | 1,277 (11.0%) |
| 8:30 AM to 8:59 AM | 303 (2.3%) | 518 (4.5%) |
| 9:00 AM to 9:59 AM | 734 (5.5%) | 582 (5.0%) |
| 10:00 AM to 10:59 AM | 202 (1.5%) | 318 (2.8%) |
| 11:00 AM to 11:59 AM | 354 (2.7%) | 389 (3.4%) |
| 12:00 PM to 3:59 PM | 850 (6.4%) | 965 (8.3%) |
| 4:00 PM to 11:59 PM | 739 (5.6%) | 453 (3.9%) |
| Total | 13,314 (100.0%) | 11,574 (100.0%) |
Housing Occupancy in Klamath County
Occupancy by Ownership in Klamath County
Of the total 28,186 dwellings in Klamath County, owner-occupied units account for 18,895 (67.0%), while renter-occupied units make up 9,291 (33.0%).
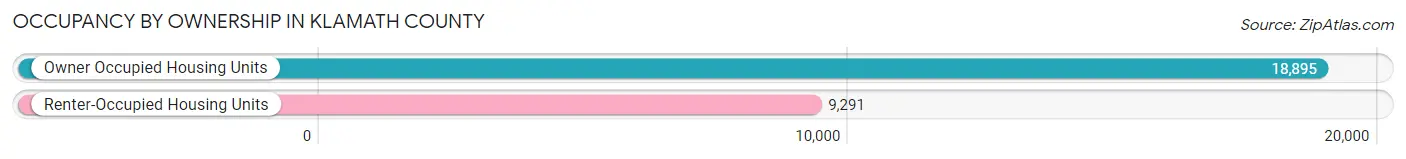
| Occupancy | # Housing Units | % Housing Units |
| Owner Occupied Housing Units | 18,895 | 67.0% |
| Renter-Occupied Housing Units | 9,291 | 33.0% |
| Total Occupied Housing Units | 28,186 | 100.0% |
Occupancy by Household Size in Klamath County
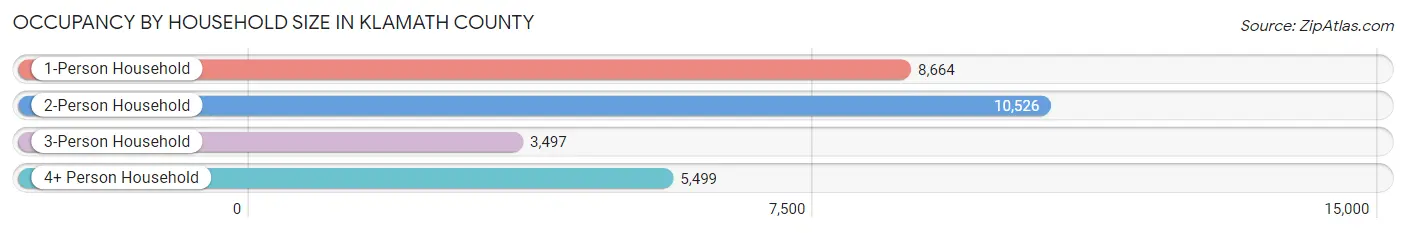
| Household Size | # Housing Units | % Housing Units |
| 1-Person Household | 8,664 | 30.7% |
| 2-Person Household | 10,526 | 37.3% |
| 3-Person Household | 3,497 | 12.4% |
| 4+ Person Household | 5,499 | 19.5% |
| Total Housing Units | 28,186 | 100.0% |
Occupancy by Ownership by Household Size in Klamath County
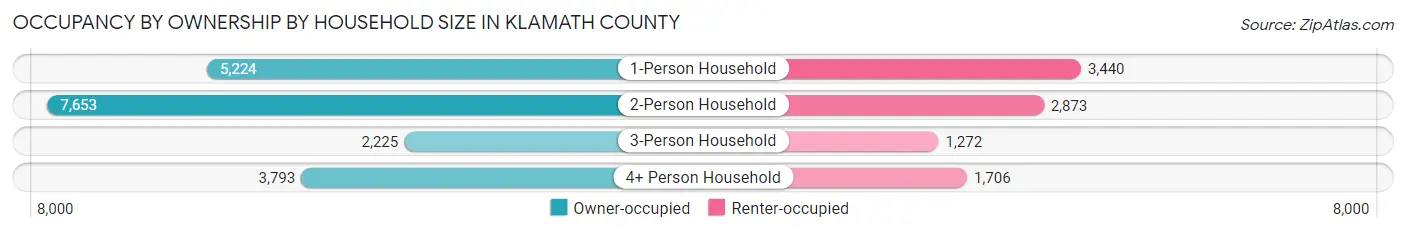
| Household Size | Owner-occupied | Renter-occupied |
| 1-Person Household | 5,224 (60.3%) | 3,440 (39.7%) |
| 2-Person Household | 7,653 (72.7%) | 2,873 (27.3%) |
| 3-Person Household | 2,225 (63.6%) | 1,272 (36.4%) |
| 4+ Person Household | 3,793 (69.0%) | 1,706 (31.0%) |
| Total Housing Units | 18,895 (67.0%) | 9,291 (33.0%) |
Occupancy by Educational Attainment in Klamath County
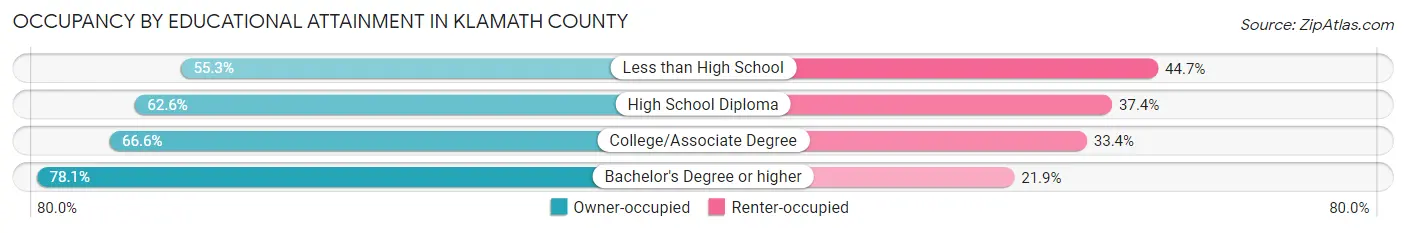
| Household Size | Owner-occupied | Renter-occupied |
| Less than High School | 1,237 (55.3%) | 1,001 (44.7%) |
| High School Diploma | 5,193 (62.6%) | 3,105 (37.4%) |
| College/Associate Degree | 7,622 (66.6%) | 3,826 (33.4%) |
| Bachelor's Degree or higher | 4,843 (78.1%) | 1,359 (21.9%) |
Occupancy by Age of Householder in Klamath County
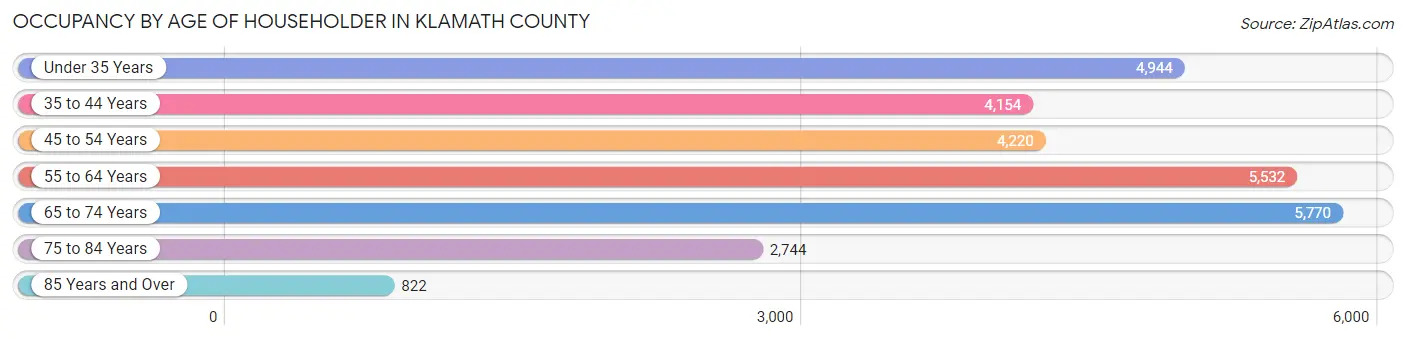
| Age Bracket | # Households | % Households |
| Under 35 Years | 4,944 | 17.5% |
| 35 to 44 Years | 4,154 | 14.7% |
| 45 to 54 Years | 4,220 | 15.0% |
| 55 to 64 Years | 5,532 | 19.6% |
| 65 to 74 Years | 5,770 | 20.5% |
| 75 to 84 Years | 2,744 | 9.7% |
| 85 Years and Over | 822 | 2.9% |
| Total | 28,186 | 100.0% |
Housing Finances in Klamath County
Median Income by Occupancy in Klamath County
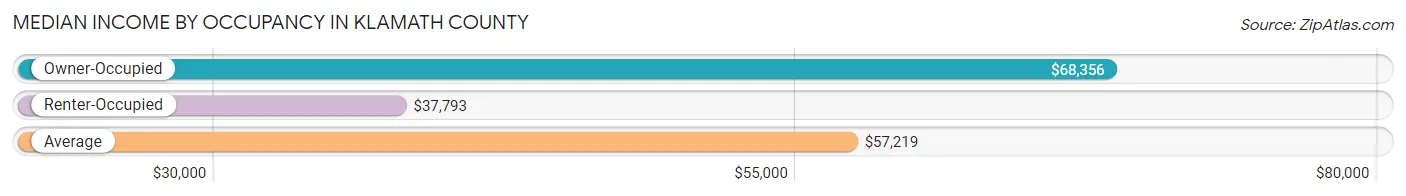
| Occupancy Type | # Households | Median Income |
| Owner-Occupied | 18,895 (67.0%) | $68,356 |
| Renter-Occupied | 9,291 (33.0%) | $37,793 |
| Average | 28,186 (100.0%) | $57,219 |
Occupancy by Householder Income Bracket in Klamath County
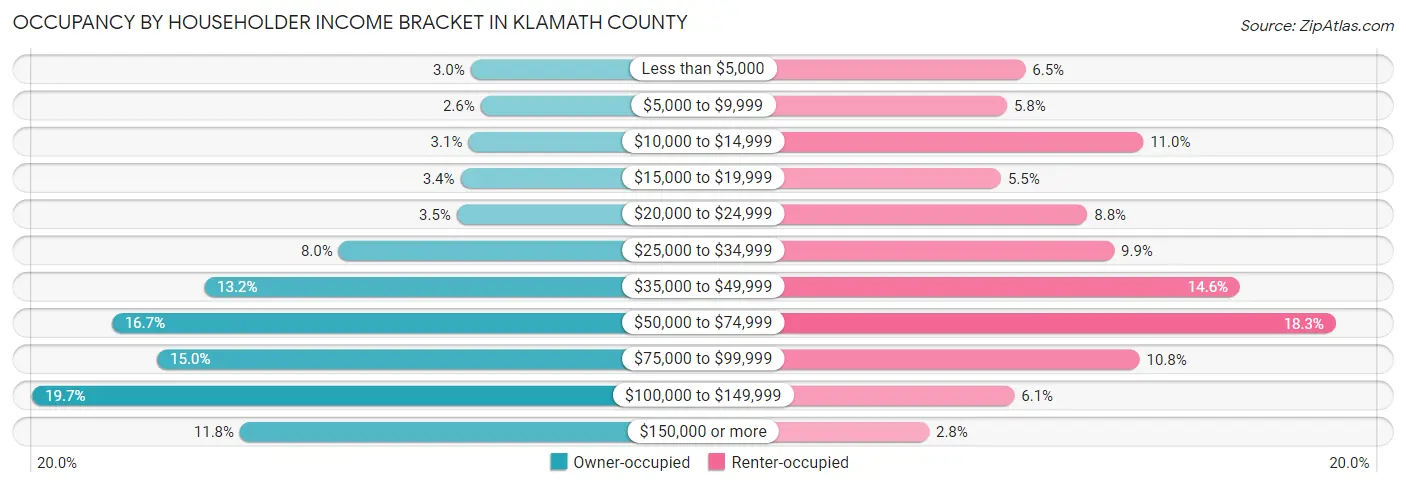
| Income Bracket | Owner-occupied | Renter-occupied |
| Less than $5,000 | 568 (3.0%) | 601 (6.5%) |
| $5,000 to $9,999 | 496 (2.6%) | 536 (5.8%) |
| $10,000 to $14,999 | 586 (3.1%) | 1,018 (11.0%) |
| $15,000 to $19,999 | 642 (3.4%) | 515 (5.5%) |
| $20,000 to $24,999 | 669 (3.5%) | 820 (8.8%) |
| $25,000 to $34,999 | 1,520 (8.0%) | 915 (9.9%) |
| $35,000 to $49,999 | 2,486 (13.2%) | 1,360 (14.6%) |
| $50,000 to $74,999 | 3,151 (16.7%) | 1,699 (18.3%) |
| $75,000 to $99,999 | 2,824 (14.9%) | 1,005 (10.8%) |
| $100,000 to $149,999 | 3,724 (19.7%) | 562 (6.0%) |
| $150,000 or more | 2,229 (11.8%) | 260 (2.8%) |
| Total | 18,895 (100.0%) | 9,291 (100.0%) |
Monthly Housing Cost Tiers in Klamath County
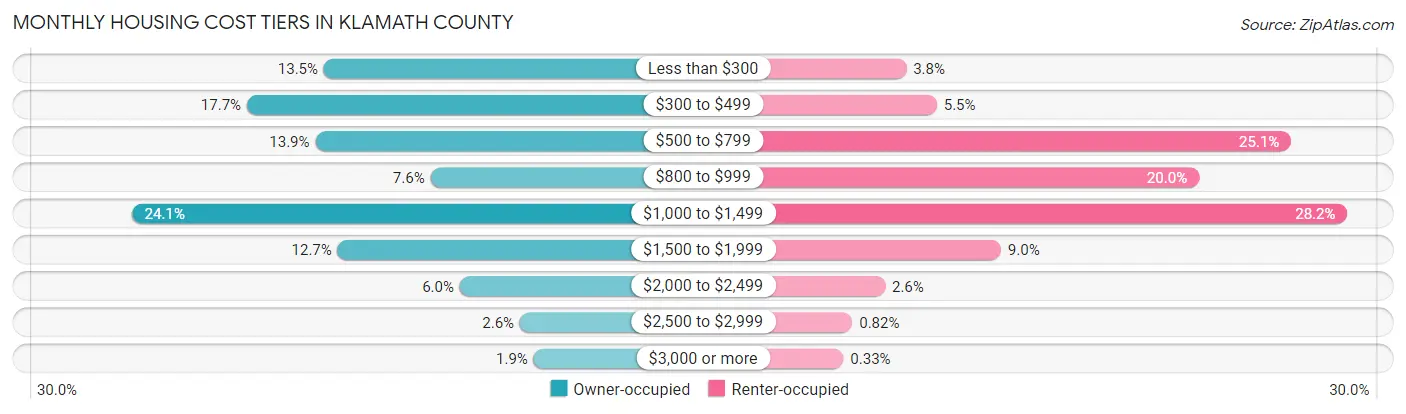
| Monthly Cost | Owner-occupied | Renter-occupied |
| Less than $300 | 2,545 (13.5%) | 353 (3.8%) |
| $300 to $499 | 3,348 (17.7%) | 510 (5.5%) |
| $500 to $799 | 2,634 (13.9%) | 2,328 (25.1%) |
| $800 to $999 | 1,433 (7.6%) | 1,855 (20.0%) |
| $1,000 to $1,499 | 4,551 (24.1%) | 2,616 (28.2%) |
| $1,500 to $1,999 | 2,402 (12.7%) | 839 (9.0%) |
| $2,000 to $2,499 | 1,127 (6.0%) | 244 (2.6%) |
| $2,500 to $2,999 | 499 (2.6%) | 76 (0.8%) |
| $3,000 or more | 356 (1.9%) | 31 (0.3%) |
| Total | 18,895 (100.0%) | 9,291 (100.0%) |
Physical Housing Characteristics in Klamath County
Housing Structures in Klamath County
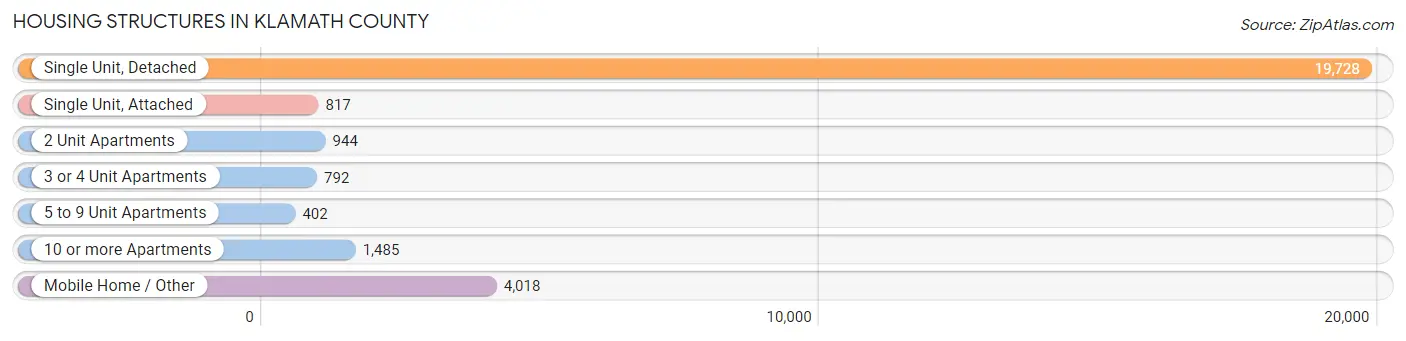
| Structure Type | # Housing Units | % Housing Units |
| Single Unit, Detached | 19,728 | 70.0% |
| Single Unit, Attached | 817 | 2.9% |
| 2 Unit Apartments | 944 | 3.4% |
| 3 or 4 Unit Apartments | 792 | 2.8% |
| 5 to 9 Unit Apartments | 402 | 1.4% |
| 10 or more Apartments | 1,485 | 5.3% |
| Mobile Home / Other | 4,018 | 14.3% |
| Total | 28,186 | 100.0% |
Housing Structures by Occupancy in Klamath County
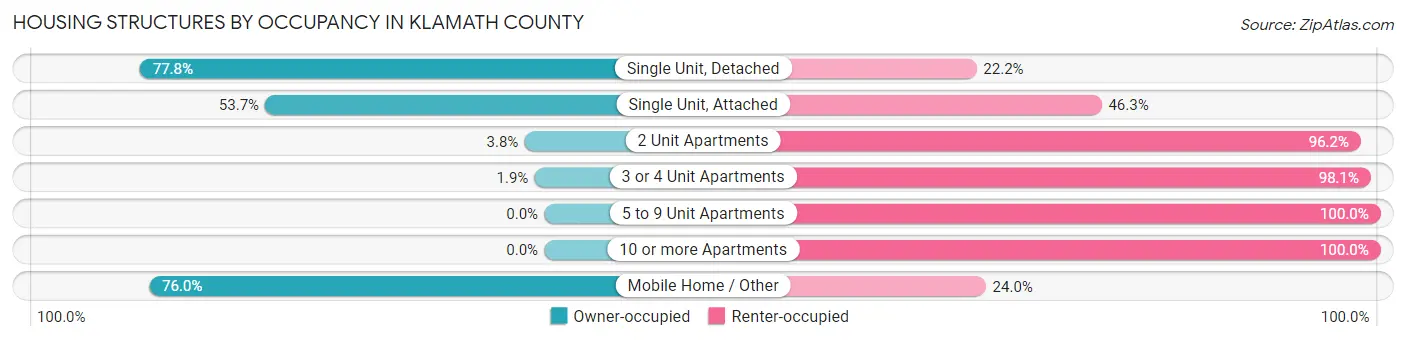
| Structure Type | Owner-occupied | Renter-occupied |
| Single Unit, Detached | 15,350 (77.8%) | 4,378 (22.2%) |
| Single Unit, Attached | 439 (53.7%) | 378 (46.3%) |
| 2 Unit Apartments | 36 (3.8%) | 908 (96.2%) |
| 3 or 4 Unit Apartments | 15 (1.9%) | 777 (98.1%) |
| 5 to 9 Unit Apartments | 0 (0.0%) | 402 (100.0%) |
| 10 or more Apartments | 0 (0.0%) | 1,485 (100.0%) |
| Mobile Home / Other | 3,055 (76.0%) | 963 (24.0%) |
| Total | 18,895 (67.0%) | 9,291 (33.0%) |
Housing Structures by Number of Rooms in Klamath County
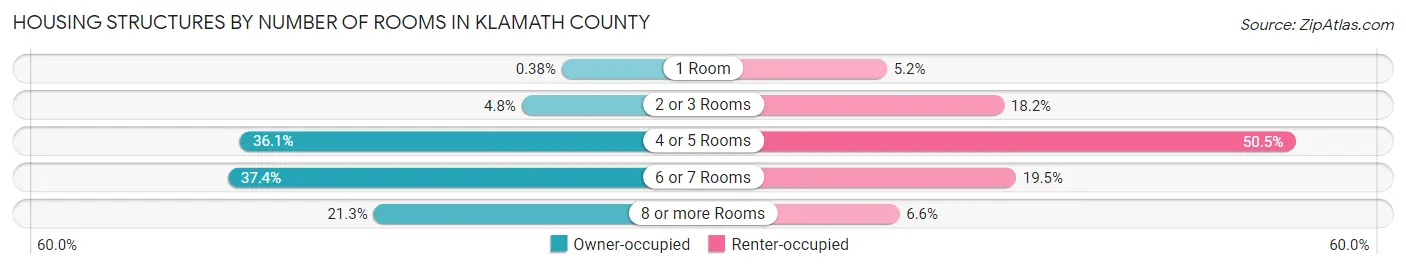
| Number of Rooms | Owner-occupied | Renter-occupied |
| 1 Room | 71 (0.4%) | 482 (5.2%) |
| 2 or 3 Rooms | 912 (4.8%) | 1,691 (18.2%) |
| 4 or 5 Rooms | 6,817 (36.1%) | 4,692 (50.5%) |
| 6 or 7 Rooms | 7,074 (37.4%) | 1,814 (19.5%) |
| 8 or more Rooms | 4,021 (21.3%) | 612 (6.6%) |
| Total | 18,895 (100.0%) | 9,291 (100.0%) |
Housing Structure by Heating Type in Klamath County
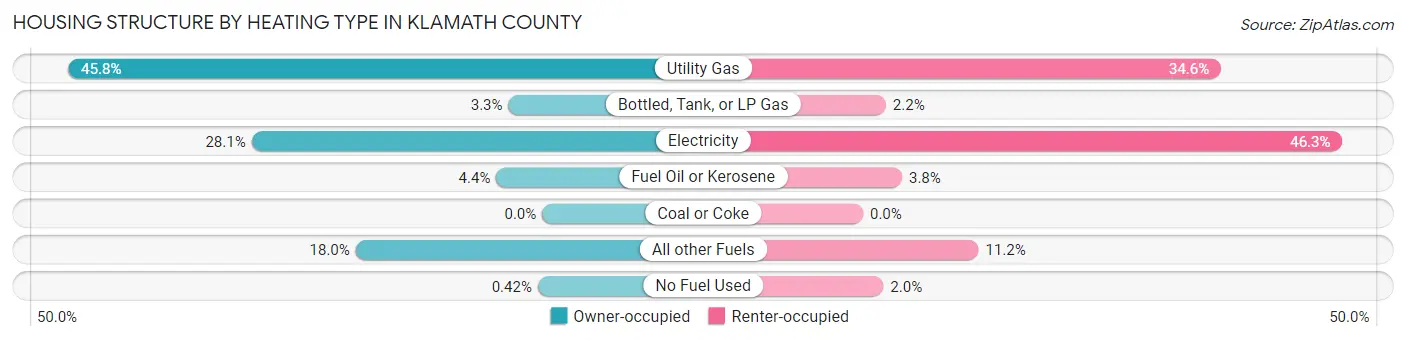
| Heating Type | Owner-occupied | Renter-occupied |
| Utility Gas | 8,652 (45.8%) | 3,214 (34.6%) |
| Bottled, Tank, or LP Gas | 616 (3.3%) | 205 (2.2%) |
| Electricity | 5,305 (28.1%) | 4,302 (46.3%) |
| Fuel Oil or Kerosene | 837 (4.4%) | 350 (3.8%) |
| Coal or Coke | 0 (0.0%) | 0 (0.0%) |
| All other Fuels | 3,405 (18.0%) | 1,037 (11.2%) |
| No Fuel Used | 80 (0.4%) | 183 (2.0%) |
| Total | 18,895 (100.0%) | 9,291 (100.0%) |
Household Vehicle Usage in Klamath County
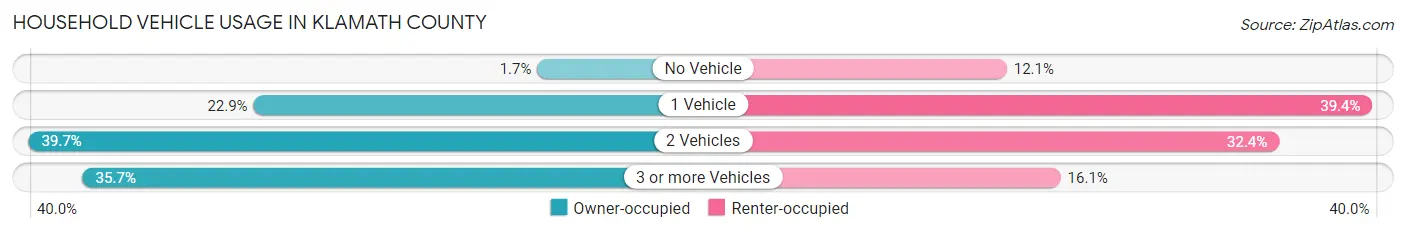
| Vehicles per Household | Owner-occupied | Renter-occupied |
| No Vehicle | 323 (1.7%) | 1,123 (12.1%) |
| 1 Vehicle | 4,329 (22.9%) | 3,659 (39.4%) |
| 2 Vehicles | 7,504 (39.7%) | 3,012 (32.4%) |
| 3 or more Vehicles | 6,739 (35.7%) | 1,497 (16.1%) |
| Total | 18,895 (100.0%) | 9,291 (100.0%) |
Real Estate & Mortgages in Klamath County
Real Estate and Mortgage Overview in Klamath County
| Characteristic | Without Mortgage | With Mortgage |
| Housing Units | 8,156 | 10,739 |
| Median Property Value | $195,800 | $258,900 |
| Median Household Income | $50,524 | $1,578 |
| Monthly Housing Costs | $386 | $356 |
| Real Estate Taxes | $1,254 | $121 |
Property Value by Mortgage Status in Klamath County
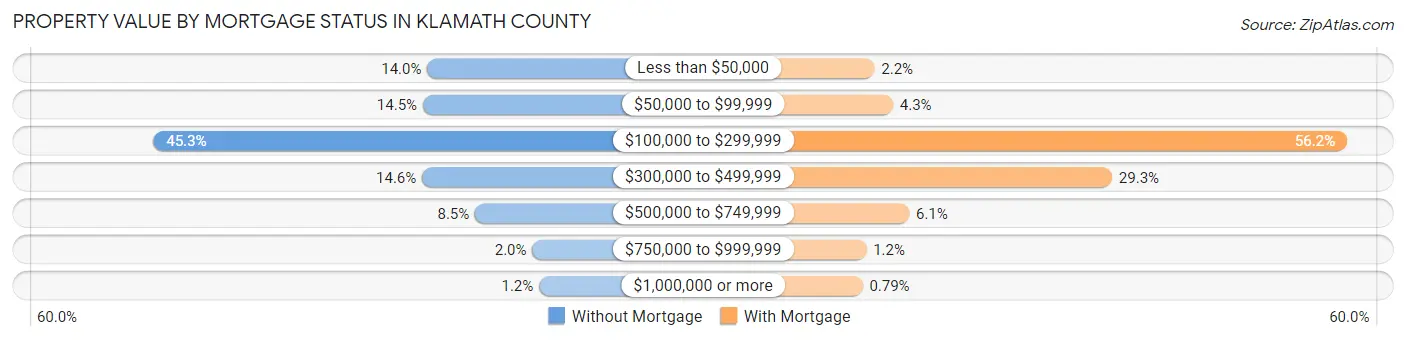
| Property Value | Without Mortgage | With Mortgage |
| Less than $50,000 | 1,140 (14.0%) | 231 (2.1%) |
| $50,000 to $99,999 | 1,181 (14.5%) | 458 (4.3%) |
| $100,000 to $299,999 | 3,694 (45.3%) | 6,031 (56.2%) |
| $300,000 to $499,999 | 1,188 (14.6%) | 3,147 (29.3%) |
| $500,000 to $749,999 | 694 (8.5%) | 656 (6.1%) |
| $750,000 to $999,999 | 161 (2.0%) | 131 (1.2%) |
| $1,000,000 or more | 98 (1.2%) | 85 (0.8%) |
| Total | 8,156 (100.0%) | 10,739 (100.0%) |
Household Income by Mortgage Status in Klamath County
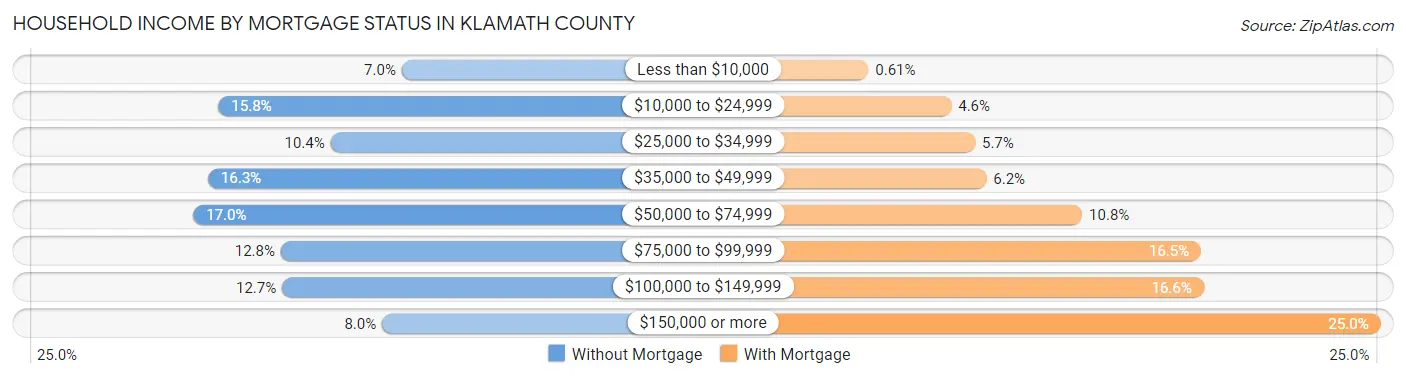
| Household Income | Without Mortgage | With Mortgage |
| Less than $10,000 | 574 (7.0%) | 65 (0.6%) |
| $10,000 to $24,999 | 1,286 (15.8%) | 490 (4.6%) |
| $25,000 to $34,999 | 851 (10.4%) | 611 (5.7%) |
| $35,000 to $49,999 | 1,327 (16.3%) | 669 (6.2%) |
| $50,000 to $74,999 | 1,384 (17.0%) | 1,159 (10.8%) |
| $75,000 to $99,999 | 1,044 (12.8%) | 1,767 (16.5%) |
| $100,000 to $149,999 | 1,039 (12.7%) | 1,780 (16.6%) |
| $150,000 or more | 651 (8.0%) | 2,685 (25.0%) |
| Total | 8,156 (100.0%) | 10,739 (100.0%) |
Property Value to Household Income Ratio in Klamath County
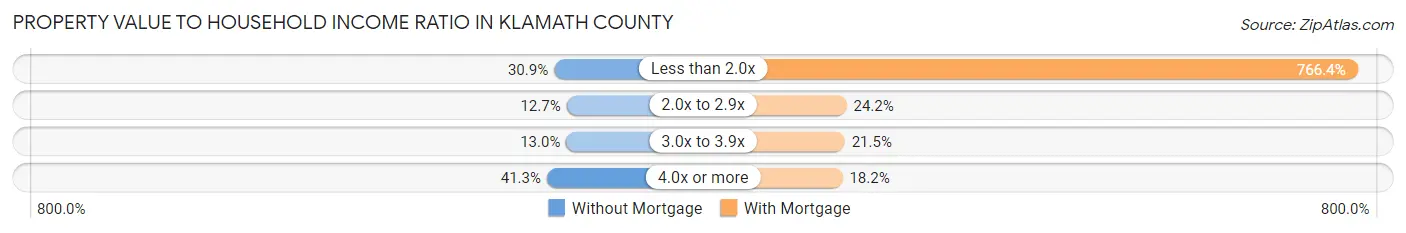
| Value-to-Income Ratio | Without Mortgage | With Mortgage |
| Less than 2.0x | 2,518 (30.9%) | 82,308 (766.4%) |
| 2.0x to 2.9x | 1,037 (12.7%) | 2,593 (24.1%) |
| 3.0x to 3.9x | 1,063 (13.0%) | 2,310 (21.5%) |
| 4.0x or more | 3,368 (41.3%) | 1,958 (18.2%) |
| Total | 8,156 (100.0%) | 10,739 (100.0%) |
Real Estate Taxes by Mortgage Status in Klamath County
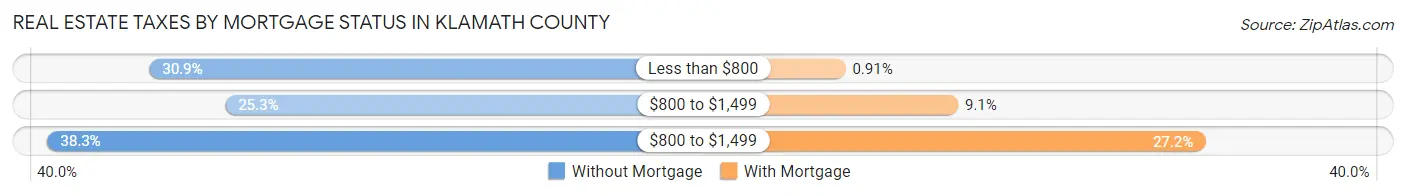
| Property Taxes | Without Mortgage | With Mortgage |
| Less than $800 | 2,519 (30.9%) | 98 (0.9%) |
| $800 to $1,499 | 2,067 (25.3%) | 981 (9.1%) |
| $800 to $1,499 | 3,126 (38.3%) | 2,920 (27.2%) |
| Total | 8,156 (100.0%) | 10,739 (100.0%) |
Health & Disability in Klamath County
Health Insurance Coverage by Age in Klamath County
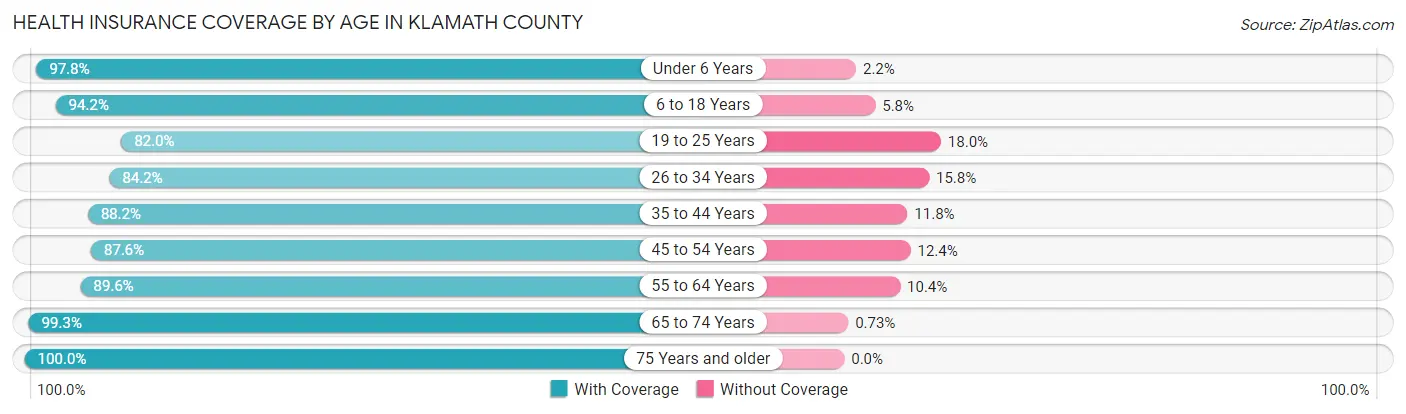
| Age Bracket | With Coverage | Without Coverage |
| Under 6 Years | 4,832 (97.8%) | 108 (2.2%) |
| 6 to 18 Years | 10,448 (94.2%) | 641 (5.8%) |
| 19 to 25 Years | 4,185 (82.0%) | 920 (18.0%) |
| 26 to 34 Years | 6,791 (84.2%) | 1,275 (15.8%) |
| 35 to 44 Years | 6,633 (88.2%) | 885 (11.8%) |
| 45 to 54 Years | 6,672 (87.6%) | 941 (12.4%) |
| 55 to 64 Years | 8,448 (89.6%) | 982 (10.4%) |
| 65 to 74 Years | 9,299 (99.3%) | 68 (0.7%) |
| 75 Years and older | 5,465 (100.0%) | 0 (0.0%) |
| Total | 62,773 (91.5%) | 5,820 (8.5%) |
Health Insurance Coverage by Citizenship Status in Klamath County
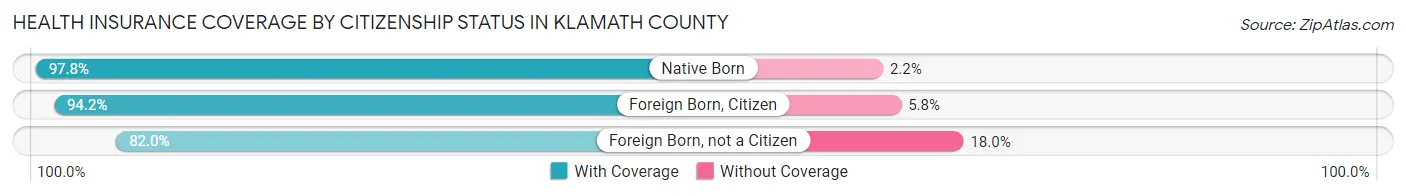
| Citizenship Status | With Coverage | Without Coverage |
| Native Born | 4,832 (97.8%) | 108 (2.2%) |
| Foreign Born, Citizen | 10,448 (94.2%) | 641 (5.8%) |
| Foreign Born, not a Citizen | 4,185 (82.0%) | 920 (18.0%) |
Health Insurance Coverage by Household Income in Klamath County
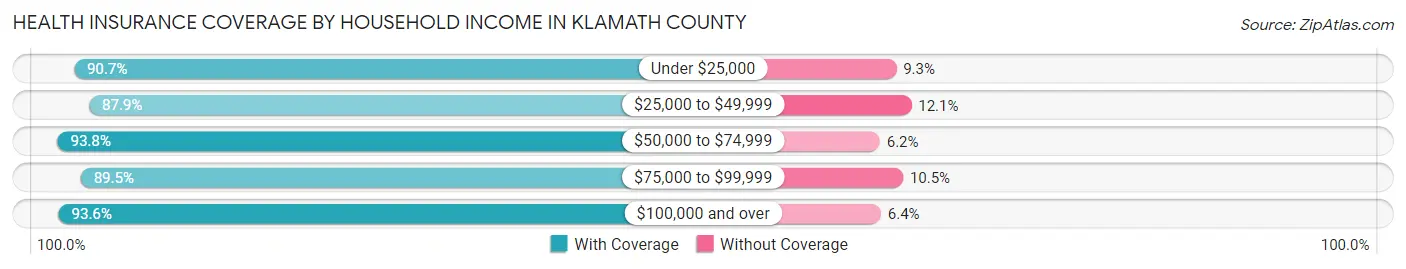
| Household Income | With Coverage | Without Coverage |
| Under $25,000 | 10,086 (90.7%) | 1,029 (9.3%) |
| $25,000 to $49,999 | 11,992 (87.9%) | 1,649 (12.1%) |
| $50,000 to $74,999 | 11,741 (93.8%) | 773 (6.2%) |
| $75,000 to $99,999 | 9,064 (89.5%) | 1,066 (10.5%) |
| $100,000 and over | 18,943 (93.6%) | 1,292 (6.4%) |
Public vs Private Health Insurance Coverage by Age in Klamath County
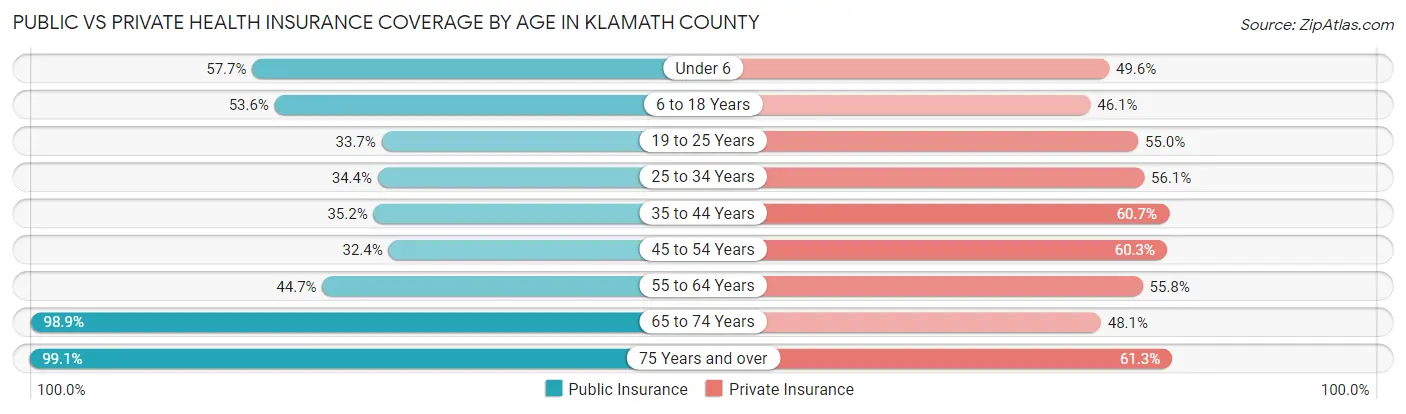
| Age Bracket | Public Insurance | Private Insurance |
| Under 6 | 2,852 (57.7%) | 2,450 (49.6%) |
| 6 to 18 Years | 5,941 (53.6%) | 5,115 (46.1%) |
| 19 to 25 Years | 1,722 (33.7%) | 2,808 (55.0%) |
| 25 to 34 Years | 2,778 (34.4%) | 4,526 (56.1%) |
| 35 to 44 Years | 2,649 (35.2%) | 4,562 (60.7%) |
| 45 to 54 Years | 2,470 (32.4%) | 4,592 (60.3%) |
| 55 to 64 Years | 4,217 (44.7%) | 5,265 (55.8%) |
| 65 to 74 Years | 9,263 (98.9%) | 4,504 (48.1%) |
| 75 Years and over | 5,418 (99.1%) | 3,350 (61.3%) |
| Total | 37,310 (54.4%) | 37,172 (54.2%) |
Disability Status by Sex by Age in Klamath County
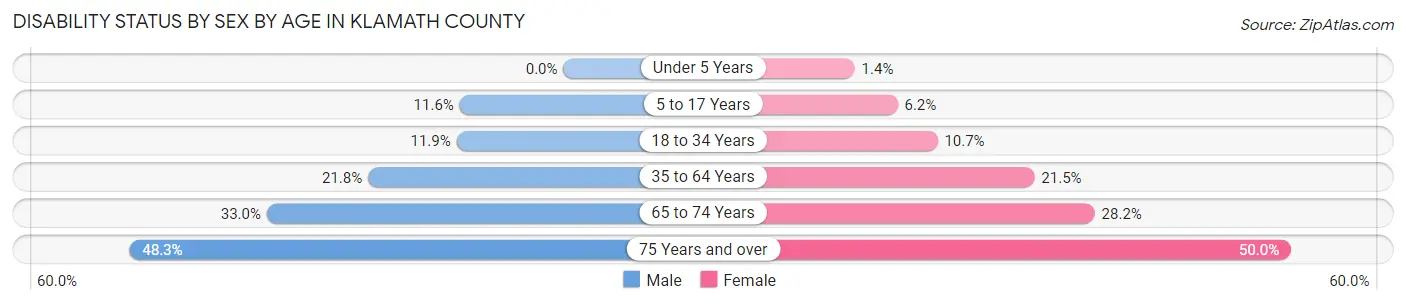
| Age Bracket | Male | Female |
| Under 5 Years | 0 (0.0%) | 28 (1.4%) |
| 5 to 17 Years | 654 (11.6%) | 341 (6.2%) |
| 18 to 34 Years | 837 (11.9%) | 752 (10.6%) |
| 35 to 64 Years | 2,658 (21.7%) | 2,647 (21.4%) |
| 65 to 74 Years | 1,546 (33.0%) | 1,320 (28.2%) |
| 75 Years and over | 1,202 (48.3%) | 1,490 (50.0%) |
Disability Class by Sex by Age in Klamath County
Disability Class: Hearing Difficulty
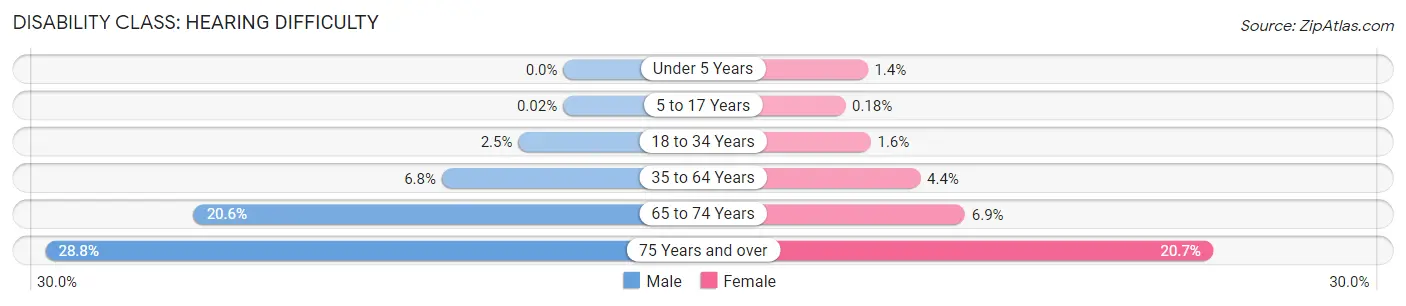
| Age Bracket | Male | Female |
| Under 5 Years | 0 (0.0%) | 28 (1.4%) |
| 5 to 17 Years | 1 (0.0%) | 10 (0.2%) |
| 18 to 34 Years | 177 (2.5%) | 113 (1.6%) |
| 35 to 64 Years | 827 (6.8%) | 538 (4.4%) |
| 65 to 74 Years | 963 (20.6%) | 321 (6.9%) |
| 75 Years and over | 717 (28.8%) | 615 (20.6%) |
Disability Class: Vision Difficulty
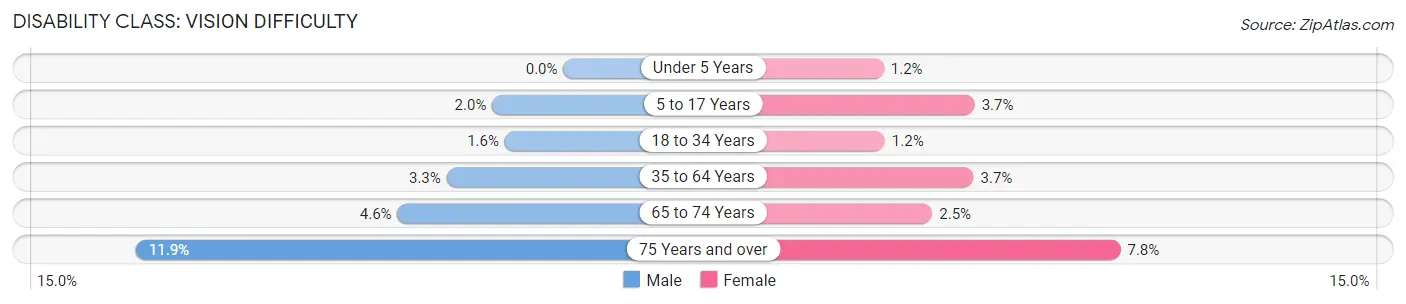
| Age Bracket | Male | Female |
| Under 5 Years | 0 (0.0%) | 23 (1.2%) |
| 5 to 17 Years | 112 (2.0%) | 203 (3.7%) |
| 18 to 34 Years | 115 (1.6%) | 85 (1.2%) |
| 35 to 64 Years | 397 (3.3%) | 453 (3.7%) |
| 65 to 74 Years | 216 (4.6%) | 118 (2.5%) |
| 75 Years and over | 296 (11.9%) | 231 (7.8%) |
Disability Class: Cognitive Difficulty
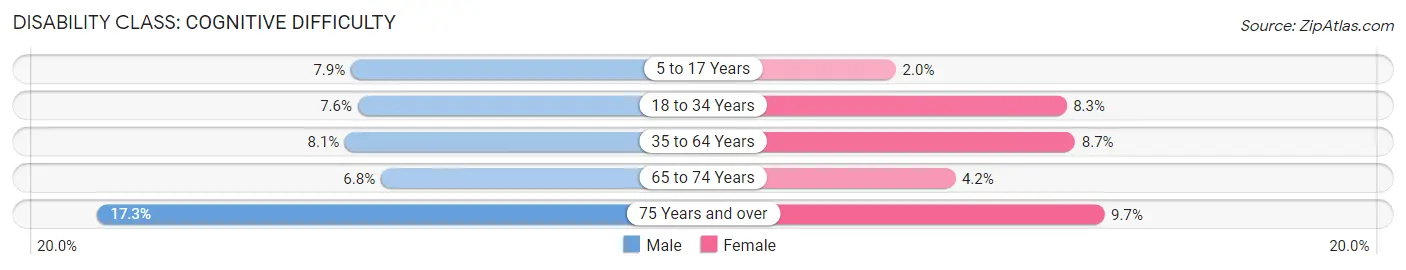
| Age Bracket | Male | Female |
| 5 to 17 Years | 446 (7.9%) | 110 (2.0%) |
| 18 to 34 Years | 537 (7.6%) | 588 (8.3%) |
| 35 to 64 Years | 990 (8.1%) | 1,067 (8.6%) |
| 65 to 74 Years | 317 (6.8%) | 197 (4.2%) |
| 75 Years and over | 430 (17.3%) | 290 (9.7%) |
Disability Class: Ambulatory Difficulty
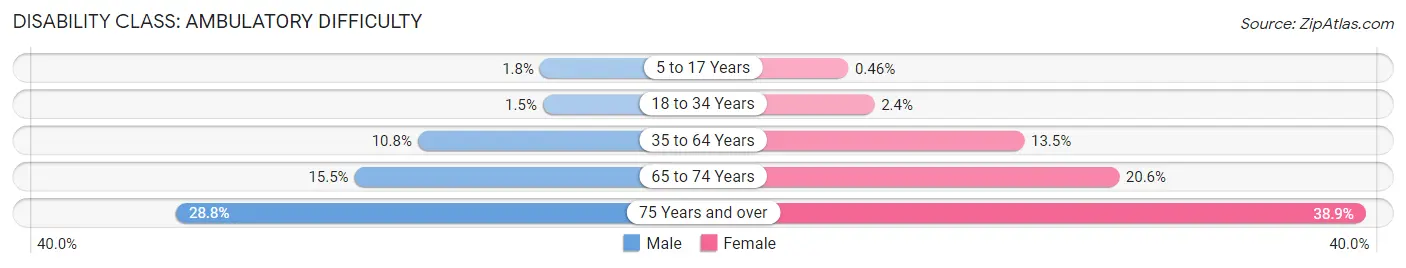
| Age Bracket | Male | Female |
| 5 to 17 Years | 99 (1.8%) | 25 (0.5%) |
| 18 to 34 Years | 108 (1.5%) | 170 (2.4%) |
| 35 to 64 Years | 1,321 (10.8%) | 1,670 (13.5%) |
| 65 to 74 Years | 726 (15.5%) | 964 (20.6%) |
| 75 Years and over | 715 (28.7%) | 1,158 (38.9%) |
Disability Class: Self-Care Difficulty
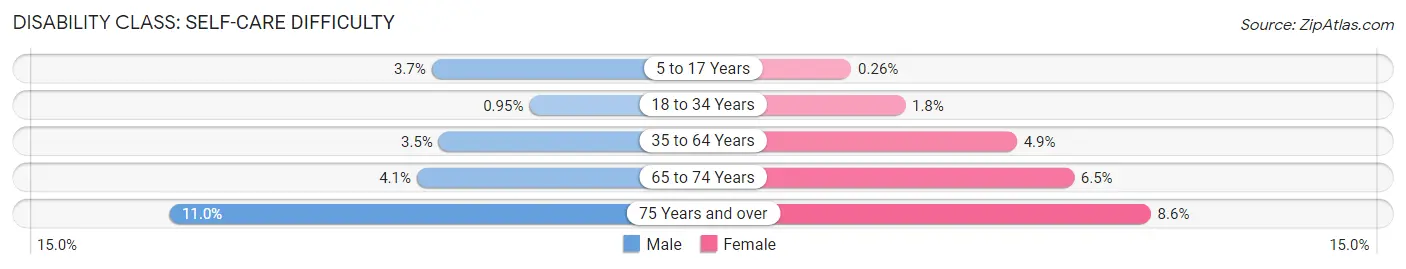
| Age Bracket | Male | Female |
| 5 to 17 Years | 208 (3.7%) | 14 (0.3%) |
| 18 to 34 Years | 67 (0.9%) | 124 (1.8%) |
| 35 to 64 Years | 424 (3.5%) | 601 (4.9%) |
| 65 to 74 Years | 191 (4.1%) | 303 (6.5%) |
| 75 Years and over | 273 (11.0%) | 256 (8.6%) |
Technology Access in Klamath County
Computing Device Access in Klamath County
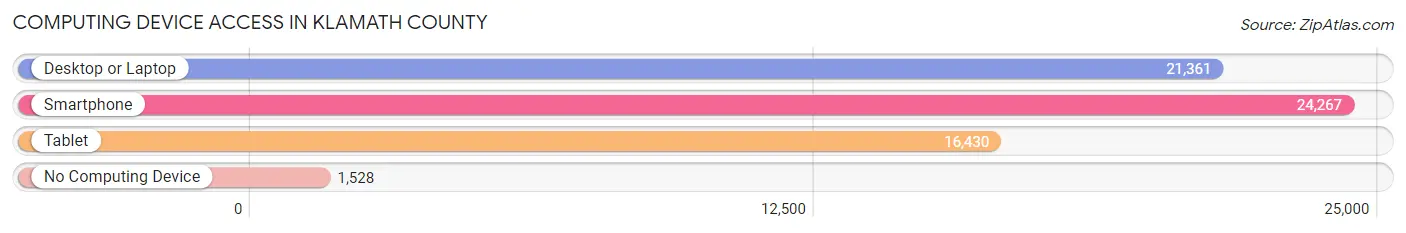
| Device Type | # Households | % Households |
| Desktop or Laptop | 21,361 | 75.8% |
| Smartphone | 24,267 | 86.1% |
| Tablet | 16,430 | 58.3% |
| No Computing Device | 1,528 | 5.4% |
| Total | 28,186 | 100.0% |
Internet Access in Klamath County
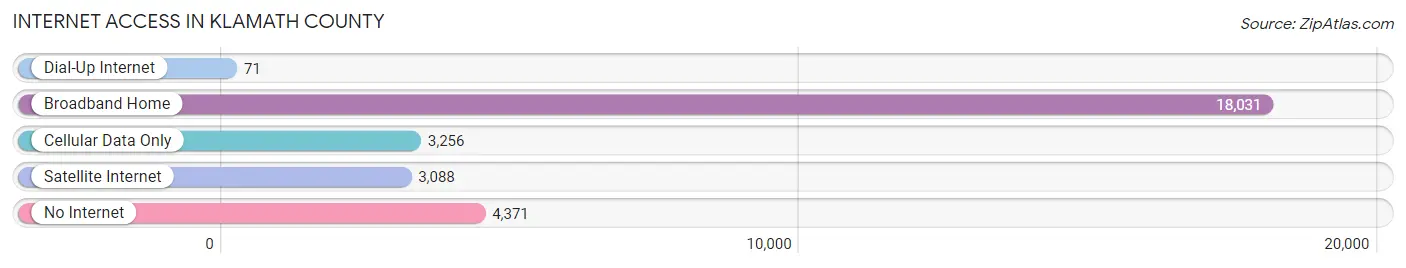
| Internet Type | # Households | % Households |
| Dial-Up Internet | 71 | 0.3% |
| Broadband Home | 18,031 | 64.0% |
| Cellular Data Only | 3,256 | 11.6% |
| Satellite Internet | 3,088 | 11.0% |
| No Internet | 4,371 | 15.5% |
| Total | 28,186 | 100.0% |
Klamath County Summary
Klamath County is located in the south-central region of Oregon, and is bordered by Lake County to the north, Deschutes County to the east, Jackson County to the south, and Curry County to the west. The county seat is Klamath Falls, and the county has a total area of 6,136 square miles, making it the fourth largest county in Oregon. As of the 2010 census, the population of Klamath County was 66,380, making it the fifth most populous county in Oregon.
Klamath County was created in 1882 from the western portion of Lake County. The county was named after the Klamath people, who had inhabited the area for centuries prior to the arrival of European settlers. The county was originally home to a variety of Native American tribes, including the Klamath, Modoc, and Yahooskin.
The economy of Klamath County is largely based on agriculture, forestry, and tourism. The county is home to a number of large agricultural operations, including the Klamath Basin Irrigation District, which provides irrigation water to over 200,000 acres of farmland. The county is also home to a number of timber companies, which harvest timber from the surrounding forests. Tourism is also an important part of the local economy, with the county being home to a number of popular outdoor recreation areas, including Crater Lake National Park, Lava Beds National Monument, and the Klamath National Forest.
Klamath County is home to a variety of different ethnic and racial groups. According to the 2010 census, the population of Klamath County was 66,380, with the largest racial group being White (77.2%), followed by Hispanic or Latino (10.2%), Native American (7.2%), and Asian (2.2%). The median household income in Klamath County was $41,945 in 2010, and the median home value was $164,400.
Klamath County is served by a number of different educational institutions, including Klamath Community College, Oregon Institute of Technology, and Klamath Falls City Schools. The county is also home to a number of different health care facilities, including Sky Lakes Medical Center, Klamath Falls Community Hospital, and Klamath Falls Clinic.
Klamath County is home to a number of different attractions, including the Klamath County Museum, the Klamath County Historical Society, and the Klamath County Fairgrounds. The county is also home to a number of different outdoor recreation areas, including Crater Lake National Park, Lava Beds National Monument, and the Klamath National Forest.
Klamath County is a beautiful and diverse region of Oregon, with a rich history, vibrant economy, and diverse population. The county is home to a variety of different ethnic and racial groups, and is served by a number of different educational and health care facilities. The county is also home to a number of different attractions, including the Klamath County Museum, the Klamath County Historical Society, and the Klamath County Fairgrounds. Klamath County is a great place to live, work, and play, and is sure to provide a wonderful experience for all who visit.
Common Questions
What is Per Capita Income in Klamath County?
Per Capita income in Klamath County is $31,260.
What is the Median Family Income in Klamath County?
Median Family Income in Klamath County is $69,223.
What is the Median Household income in Klamath County?
Median Household Income in Klamath County is $57,219.
What is Income or Wage Gap in Klamath County?
Income or Wage Gap in Klamath County is 28.8%.
Women in Klamath County earn 71.2 cents for every dollar earned by a man.
What is Family Income Deficit in Klamath County?
Family Income Deficit in Klamath County is $12,045.
Families that are below poverty line in Klamath County earn $12,045 less on average than the poverty threshold level.
What is Inequality or Gini Index in Klamath County?
Inequality or Gini Index in Klamath County is 0.47.
What is the Total Population of Klamath County?
Total Population of Klamath County is 69,506.
What is the Total Male Population of Klamath County?
Total Male Population of Klamath County is 34,762.
What is the Total Female Population of Klamath County?
Total Female Population of Klamath County is 34,744.
What is the Ratio of Males per 100 Females in Klamath County?
There are 100.05 Males per 100 Females in Klamath County.
What is the Ratio of Females per 100 Males in Klamath County?
There are 99.95 Females per 100 Males in Klamath County.
What is the Median Population Age in Klamath County?
Median Population Age in Klamath County is 41.1 Years.
What is the Average Family Size in Klamath County
Average Family Size in Klamath County is 3.0 People.
What is the Average Household Size in Klamath County
Average Household Size in Klamath County is 2.4 People.
How Large is the Labor Force in Klamath County?
There are 29,392 People in the Labor Forcein in Klamath County.
What is the Percentage of People in the Labor Force in Klamath County?
52.5% of People are in the Labor Force in Klamath County.
What is the Unemployment Rate in Klamath County?
Unemployment Rate in Klamath County is 7.6%.