Zip Codes with the Highest Percentage of Population with a Degree in Arts and Humanities in Oklahoma
RELATED REPORTS & OPTIONS
Arts and Humanities
Oklahoma
Compare Zip Codes
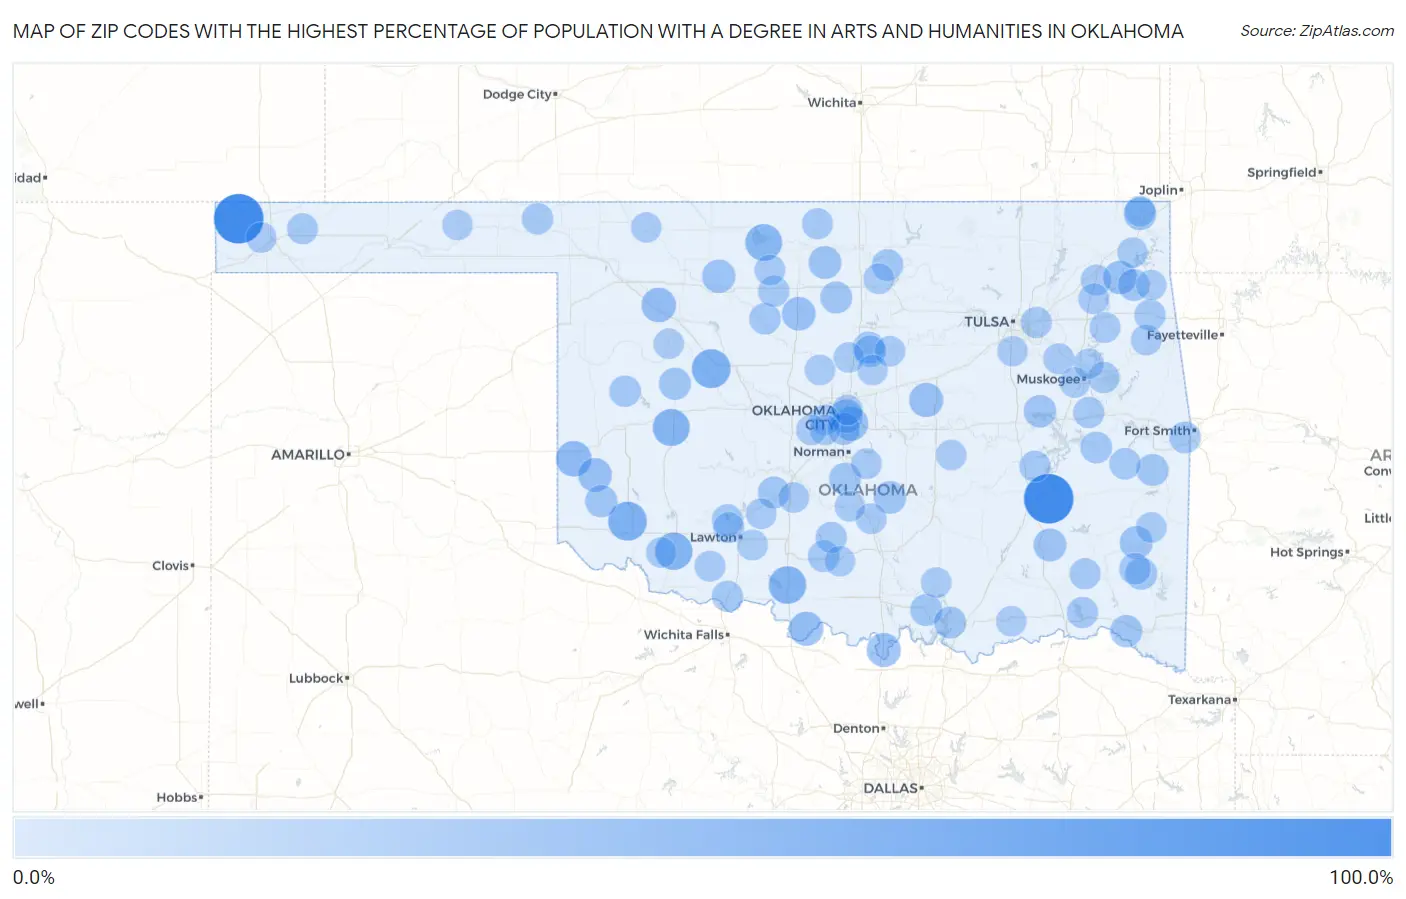
Map of Zip Codes with the Highest Percentage of Population with a Degree in Arts and Humanities in Oklahoma
0.0%
100.0%
Zip Codes with the Highest Percentage of Population with a Degree in Arts and Humanities in Oklahoma
| Zip Code | % Graduates | vs State | vs National | |
| 1. | 74522 | 100.0% | 7.2%(+92.8)#1 | 6.0%(+94.0)#48 |
| 2. | 73946 | 100.0% | 7.2%(+92.8)#2 | 6.0%(+94.0)#80 |
| 3. | 73646 | 50.0% | 7.2%(+42.8)#3 | 6.0%(+44.0)#214 |
| 4. | 73556 | 50.0% | 7.2%(+42.8)#4 | 6.0%(+44.0)#232 |
| 5. | 73520 | 44.4% | 7.2%(+37.3)#5 | 6.0%(+38.4)#282 |
| 6. | 73555 | 43.8% | 7.2%(+36.6)#6 | 6.0%(+37.8)#294 |
| 7. | 73622 | 41.7% | 7.2%(+34.5)#7 | 6.0%(+35.7)#320 |
| 8. | 73749 | 41.1% | 7.2%(+34.0)#8 | 6.0%(+35.1)#329 |
| 9. | 73645 | 35.4% | 7.2%(+28.3)#9 | 6.0%(+29.4)#462 |
| 10. | 73853 | 30.5% | 7.2%(+23.3)#10 | 6.0%(+24.5)#641 |
| 11. | 73569 | 29.0% | 7.2%(+21.9)#11 | 6.0%(+23.0)#705 |
| 12. | 74869 | 28.9% | 7.2%(+21.8)#12 | 6.0%(+23.0)#709 |
| 13. | 73145 | 28.7% | 7.2%(+21.5)#13 | 6.0%(+22.7)#717 |
| 14. | 73459 | 28.2% | 7.2%(+21.0)#14 | 6.0%(+22.2)#748 |
| 15. | 73673 | 27.6% | 7.2%(+20.4)#15 | 6.0%(+21.6)#787 |
| 16. | 73720 | 26.7% | 7.2%(+19.5)#16 | 6.0%(+20.7)#853 |
| 17. | 73117 | 26.0% | 7.2%(+18.8)#17 | 6.0%(+20.0)#891 |
| 18. | 74350 | 25.8% | 7.2%(+18.7)#18 | 6.0%(+19.8)#899 |
| 19. | 73716 | 25.4% | 7.2%(+18.2)#19 | 6.0%(+19.4)#925 |
| 20. | 74540 | 23.5% | 7.2%(+16.4)#20 | 6.0%(+17.5)#1,067 |
| 21. | 74549 | 23.5% | 7.2%(+16.4)#21 | 6.0%(+17.5)#1,068 |
| 22. | 74640 | 23.3% | 7.2%(+16.1)#22 | 6.0%(+17.3)#1,092 |
| 23. | 74358 | 22.2% | 7.2%(+15.1)#23 | 6.0%(+16.2)#1,202 |
| 24. | 74438 | 21.7% | 7.2%(+14.6)#24 | 6.0%(+15.7)#1,264 |
| 25. | 74831 | 21.6% | 7.2%(+14.4)#25 | 6.0%(+15.6)#1,282 |
| 26. | 73149 | 21.3% | 7.2%(+14.1)#26 | 6.0%(+15.3)#1,313 |
| 27. | 73554 | 20.6% | 7.2%(+13.4)#27 | 6.0%(+14.6)#1,405 |
| 28. | 74736 | 20.5% | 7.2%(+13.3)#28 | 6.0%(+14.5)#1,414 |
| 29. | 73639 | 20.0% | 7.2%(+12.8)#29 | 6.0%(+14.0)#1,481 |
| 30. | 74956 | 19.6% | 7.2%(+12.4)#30 | 6.0%(+13.6)#1,561 |
| 31. | 73446 | 19.4% | 7.2%(+12.2)#31 | 6.0%(+13.4)#1,590 |
| 32. | 73730 | 19.4% | 7.2%(+12.2)#32 | 6.0%(+13.4)#1,594 |
| 33. | 74724 | 19.4% | 7.2%(+12.2)#33 | 6.0%(+13.4)#1,599 |
| 34. | 73449 | 19.3% | 7.2%(+12.1)#34 | 6.0%(+13.3)#1,606 |
| 35. | 73080 | 19.2% | 7.2%(+12.0)#35 | 6.0%(+13.2)#1,627 |
| 36. | 73017 | 18.9% | 7.2%(+11.7)#36 | 6.0%(+12.9)#1,663 |
| 37. | 73027 | 18.4% | 7.2%(+11.2)#37 | 6.0%(+12.4)#1,753 |
| 38. | 74342 | 18.4% | 7.2%(+11.2)#38 | 6.0%(+12.4)#1,761 |
| 39. | 74472 | 18.2% | 7.2%(+11.0)#39 | 6.0%(+12.2)#1,801 |
| 40. | 73491 | 18.1% | 7.2%(+10.9)#40 | 6.0%(+12.1)#1,835 |
| 41. | 74901 | 17.7% | 7.2%(+10.5)#41 | 6.0%(+11.7)#1,915 |
| 42. | 73557 | 17.6% | 7.2%(+10.4)#42 | 6.0%(+11.6)#1,941 |
| 43. | 73050 | 17.5% | 7.2%(+10.3)#43 | 6.0%(+11.5)#1,966 |
| 44. | 74722 | 17.4% | 7.2%(+10.2)#44 | 6.0%(+11.4)#1,991 |
| 45. | 74644 | 17.2% | 7.2%(+10.1)#45 | 6.0%(+11.2)#2,023 |
| 46. | 73718 | 17.2% | 7.2%(+10.1)#46 | 6.0%(+11.2)#2,024 |
| 47. | 73650 | 16.9% | 7.2%(+9.76)#47 | 6.0%(+10.9)#2,089 |
| 48. | 74944 | 16.6% | 7.2%(+9.38)#48 | 6.0%(+10.6)#2,207 |
| 49. | 74434 | 16.3% | 7.2%(+9.17)#49 | 6.0%(+10.3)#2,253 |
| 50. | 73844 | 16.3% | 7.2%(+9.16)#50 | 6.0%(+10.3)#2,259 |
| 51. | 74756 | 16.2% | 7.2%(+8.99)#51 | 6.0%(+10.2)#2,300 |
| 52. | 73754 | 16.1% | 7.2%(+8.94)#52 | 6.0%(+10.1)#2,318 |
| 53. | 73434 | 16.0% | 7.2%(+8.83)#53 | 6.0%(+10.0)#2,345 |
| 54. | 74108 | 15.9% | 7.2%(+8.78)#54 | 6.0%(+9.95)#2,363 |
| 55. | 74469 | 15.8% | 7.2%(+8.65)#55 | 6.0%(+9.83)#2,389 |
| 56. | 73531 | 15.5% | 7.2%(+8.32)#56 | 6.0%(+9.50)#2,496 |
| 57. | 74442 | 15.3% | 7.2%(+8.08)#57 | 6.0%(+9.26)#2,575 |
| 58. | 74347 | 15.2% | 7.2%(+8.07)#58 | 6.0%(+9.25)#2,578 |
| 59. | 74543 | 15.2% | 7.2%(+8.02)#59 | 6.0%(+9.19)#2,601 |
| 60. | 73947 | 15.1% | 7.2%(+7.91)#60 | 6.0%(+9.09)#2,640 |
| 61. | 73759 | 15.0% | 7.2%(+7.79)#61 | 6.0%(+8.97)#2,692 |
| 62. | 74330 | 14.5% | 7.2%(+7.30)#62 | 6.0%(+8.47)#2,896 |
| 63. | 73528 | 14.4% | 7.2%(+7.20)#63 | 6.0%(+8.38)#2,941 |
| 64. | 74458 | 14.3% | 7.2%(+7.11)#64 | 6.0%(+8.29)#3,003 |
| 65. | 73503 | 14.3% | 7.2%(+7.08)#65 | 6.0%(+8.26)#3,011 |
| 66. | 73501 | 14.2% | 7.2%(+7.02)#66 | 6.0%(+8.20)#3,033 |
| 67. | 74352 | 14.2% | 7.2%(+6.99)#67 | 6.0%(+8.17)#3,050 |
| 68. | 74361 | 14.1% | 7.2%(+6.92)#68 | 6.0%(+8.10)#3,079 |
| 69. | 74457 | 13.8% | 7.2%(+6.68)#69 | 6.0%(+7.85)#3,200 |
| 70. | 73068 | 13.8% | 7.2%(+6.61)#70 | 6.0%(+7.78)#3,235 |
| 71. | 73075 | 13.7% | 7.2%(+6.49)#71 | 6.0%(+7.67)#3,279 |
| 72. | 73541 | 13.5% | 7.2%(+6.38)#72 | 6.0%(+7.55)#3,339 |
| 73. | 73933 | 13.4% | 7.2%(+6.20)#73 | 6.0%(+7.37)#3,425 |
| 74. | 73121 | 13.4% | 7.2%(+6.19)#74 | 6.0%(+7.37)#3,427 |
| 75. | 73067 | 13.3% | 7.2%(+6.16)#75 | 6.0%(+7.34)#3,437 |
| 76. | 73739 | 13.3% | 7.2%(+6.16)#76 | 6.0%(+7.34)#3,449 |
| 77. | 74651 | 13.3% | 7.2%(+6.09)#77 | 6.0%(+7.27)#3,491 |
| 78. | 74059 | 13.2% | 7.2%(+6.03)#78 | 6.0%(+7.20)#3,522 |
| 79. | 74884 | 13.2% | 7.2%(+5.98)#79 | 6.0%(+7.16)#3,550 |
| 80. | 73016 | 13.1% | 7.2%(+5.98)#80 | 6.0%(+7.15)#3,552 |
| 81. | 73128 | 13.1% | 7.2%(+5.89)#81 | 6.0%(+7.07)#3,603 |
| 82. | 74949 | 13.0% | 7.2%(+5.87)#82 | 6.0%(+7.05)#3,618 |
| 83. | 73667 | 13.0% | 7.2%(+5.83)#83 | 6.0%(+7.00)#3,640 |
| 84. | 73842 | 12.9% | 7.2%(+5.73)#84 | 6.0%(+6.91)#3,706 |
| 85. | 73044 | 12.9% | 7.2%(+5.72)#85 | 6.0%(+6.89)#3,716 |
| 86. | 74339 | 12.8% | 7.2%(+5.59)#86 | 6.0%(+6.77)#3,795 |
| 87. | 74331 | 12.7% | 7.2%(+5.58)#87 | 6.0%(+6.75)#3,806 |
| 88. | 73481 | 12.7% | 7.2%(+5.53)#88 | 6.0%(+6.70)#3,837 |
| 89. | 74723 | 12.6% | 7.2%(+5.39)#89 | 6.0%(+6.57)#3,908 |
| 90. | 74033 | 12.6% | 7.2%(+5.38)#90 | 6.0%(+6.56)#3,916 |
| 91. | 73169 | 12.5% | 7.2%(+5.36)#91 | 6.0%(+6.53)#3,930 |
| 92. | 73064 | 12.5% | 7.2%(+5.35)#92 | 6.0%(+6.53)#3,932 |
| 93. | 74346 | 12.5% | 7.2%(+5.35)#93 | 6.0%(+6.52)#3,934 |
| 94. | 74401 | 12.5% | 7.2%(+5.34)#94 | 6.0%(+6.51)#3,936 |
| 95. | 73057 | 12.5% | 7.2%(+5.33)#95 | 6.0%(+6.50)#3,946 |
| 96. | 74446 | 12.5% | 7.2%(+5.33)#96 | 6.0%(+6.50)#3,969 |
| 97. | 73058 | 12.5% | 7.2%(+5.33)#97 | 6.0%(+6.50)#3,982 |
| 98. | 73950 | 12.4% | 7.2%(+5.21)#98 | 6.0%(+6.39)#4,059 |
| 99. | 73460 | 12.3% | 7.2%(+5.17)#99 | 6.0%(+6.35)#4,090 |
| 100. | 73570 | 12.3% | 7.2%(+5.15)#100 | 6.0%(+6.32)#4,101 |
Common Questions
What are the Top 10 Zip Codes with the Highest Percentage of Population with a Degree in Arts and Humanities in Oklahoma?
Top 10 Zip Codes with the Highest Percentage of Population with a Degree in Arts and Humanities in Oklahoma are:
What zip code has the Highest Percentage of Population with a Degree in Arts and Humanities in Oklahoma?
74522 has the Highest Percentage of Population with a Degree in Arts and Humanities in Oklahoma with 100.0%.
What is the Percentage of Population with a Degree in Arts and Humanities in the State of Oklahoma?
Percentage of Population with a Degree in Arts and Humanities in Oklahoma is 7.2%.
What is the Percentage of Population with a Degree in Arts and Humanities in the United States?
Percentage of Population with a Degree in Arts and Humanities in the United States is 6.0%.