Zip Codes with the Highest Percentage of Households Heated by Fuel Oil / Kerosene in Oklahoma
RELATED REPORTS & OPTIONS
Fuel Oil Heating
Oklahoma
Compare Zip Codes
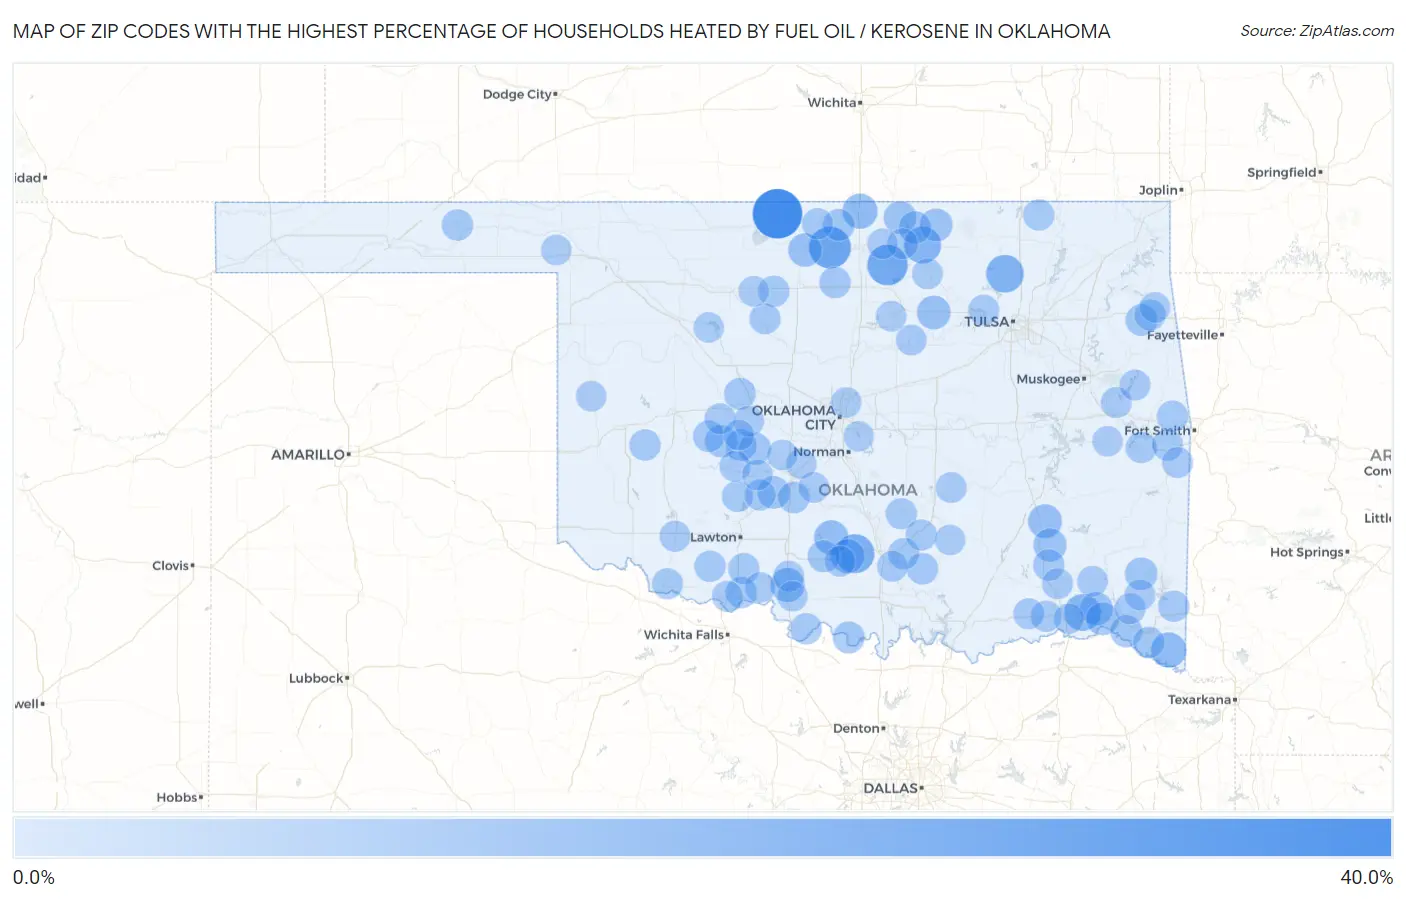
Map of Zip Codes with the Highest Percentage of Households Heated by Fuel Oil / Kerosene in Oklahoma
0.0%
40.0%
Zip Codes with the Highest Percentage of Households Heated by Fuel Oil / Kerosene in Oklahoma
| Zip Code | Fuel Oil Heating | vs State | vs National | |
| 1. | 73758 | 38.4% | 0.20%(+38.2)#1 | 4.2%(+34.2)#2,685 |
| 2. | 74643 | 22.8% | 0.20%(+22.6)#2 | 4.2%(+18.6)#3,997 |
| 3. | 74644 | 20.3% | 0.20%(+20.1)#3 | 4.2%(+16.1)#4,247 |
| 4. | 73444 | 16.9% | 0.20%(+16.7)#4 | 4.2%(+12.7)#4,695 |
| 5. | 74001 | 14.7% | 0.20%(+14.5)#5 | 4.2%(+10.5)#5,059 |
| 6. | 74633 | 13.5% | 0.20%(+13.3)#6 | 4.2%(+9.30)#5,264 |
| 7. | 74756 | 13.0% | 0.20%(+12.8)#7 | 4.2%(+8.80)#5,353 |
| 8. | 74740 | 10.0% | 0.20%(+9.80)#8 | 4.2%(+5.80)#6,066 |
| 9. | 74632 | 9.5% | 0.20%(+9.30)#9 | 4.2%(+5.30)#6,224 |
| 10. | 73434 | 8.3% | 0.20%(+8.10)#10 | 4.2%(+4.10)#6,604 |
| 11. | 73520 | 8.1% | 0.20%(+7.90)#11 | 4.2%(+3.90)#6,696 |
| 12. | 73487 | 7.7% | 0.20%(+7.50)#12 | 4.2%(+3.50)#6,853 |
| 13. | 74528 | 7.3% | 0.20%(+7.10)#13 | 4.2%(+3.10)#7,019 |
| 14. | 74045 | 6.9% | 0.20%(+6.70)#14 | 4.2%(+2.70)#7,179 |
| 15. | 73766 | 6.6% | 0.20%(+6.40)#15 | 4.2%(+2.40)#7,308 |
| 16. | 74540 | 6.0% | 0.20%(+5.80)#16 | 4.2%(+1.80)#7,603 |
| 17. | 74735 | 5.9% | 0.20%(+5.70)#17 | 4.2%(+1.70)#7,644 |
| 18. | 74761 | 5.3% | 0.20%(+5.10)#18 | 4.2%(+1.10)#7,993 |
| 19. | 74652 | 5.2% | 0.20%(+5.00)#19 | 4.2%(+1.00)#8,039 |
| 20. | 74647 | 5.1% | 0.20%(+4.90)#20 | 4.2%(+0.900)#8,085 |
| 21. | 74724 | 4.7% | 0.20%(+4.50)#21 | 4.2%(+0.500)#8,352 |
| 22. | 73017 | 4.6% | 0.20%(+4.40)#22 | 4.2%(+0.400)#8,404 |
| 23. | 74641 | 4.6% | 0.20%(+4.40)#23 | 4.2%(+0.400)#8,421 |
| 24. | 73033 | 4.3% | 0.20%(+4.10)#24 | 4.2%(+0.100)#8,613 |
| 25. | 73042 | 4.1% | 0.20%(+3.90)#25 | 4.2%(-0.100)#8,763 |
| 26. | 74736 | 3.8% | 0.20%(+3.60)#26 | 4.2%(-0.400)#8,999 |
| 27. | 73491 | 3.7% | 0.20%(+3.50)#27 | 4.2%(-0.500)#9,089 |
| 28. | 74636 | 3.4% | 0.20%(+3.20)#28 | 4.2%(-0.800)#9,382 |
| 29. | 73441 | 3.4% | 0.20%(+3.20)#29 | 4.2%(-0.800)#9,385 |
| 30. | 73067 | 3.0% | 0.20%(+2.80)#30 | 4.2%(-1.20)#9,717 |
| 31. | 73040 | 2.9% | 0.20%(+2.70)#31 | 4.2%(-1.30)#9,838 |
| 32. | 74359 | 2.9% | 0.20%(+2.70)#32 | 4.2%(-1.30)#9,866 |
| 33. | 73009 | 2.8% | 0.20%(+2.60)#33 | 4.2%(-1.40)#9,951 |
| 34. | 73021 | 2.8% | 0.20%(+2.60)#34 | 4.2%(-1.40)#9,968 |
| 35. | 73738 | 2.6% | 0.20%(+2.40)#35 | 4.2%(-1.60)#10,177 |
| 36. | 74856 | 2.6% | 0.20%(+2.40)#36 | 4.2%(-1.60)#10,183 |
| 37. | 73562 | 2.6% | 0.20%(+2.40)#37 | 4.2%(-1.60)#10,187 |
| 38. | 74745 | 2.5% | 0.20%(+2.30)#38 | 4.2%(-1.70)#10,225 |
| 39. | 73086 | 2.5% | 0.20%(+2.30)#39 | 4.2%(-1.70)#10,228 |
| 40. | 74557 | 2.4% | 0.20%(+2.20)#40 | 4.2%(-1.80)#10,413 |
| 41. | 74948 | 2.3% | 0.20%(+2.10)#41 | 4.2%(-1.90)#10,475 |
| 42. | 73950 | 2.3% | 0.20%(+2.10)#42 | 4.2%(-1.90)#10,538 |
| 43. | 73754 | 2.3% | 0.20%(+2.10)#43 | 4.2%(-1.90)#10,545 |
| 44. | 73528 | 2.3% | 0.20%(+2.10)#44 | 4.2%(-1.90)#10,561 |
| 45. | 73641 | 2.3% | 0.20%(+2.10)#45 | 4.2%(-1.90)#10,569 |
| 46. | 74872 | 2.2% | 0.20%(+2.00)#46 | 4.2%(-2.00)#10,657 |
| 47. | 73569 | 2.2% | 0.20%(+2.00)#47 | 4.2%(-2.00)#10,715 |
| 48. | 73572 | 2.1% | 0.20%(+1.90)#48 | 4.2%(-2.10)#10,795 |
| 49. | 74865 | 2.1% | 0.20%(+1.90)#49 | 4.2%(-2.10)#10,815 |
| 50. | 74734 | 2.1% | 0.20%(+1.90)#50 | 4.2%(-2.10)#10,848 |
| 51. | 74347 | 2.0% | 0.20%(+1.80)#51 | 4.2%(-2.20)#10,950 |
| 52. | 74941 | 2.0% | 0.20%(+1.80)#52 | 4.2%(-2.20)#10,952 |
| 53. | 73006 | 2.0% | 0.20%(+1.80)#53 | 4.2%(-2.20)#10,954 |
| 54. | 74083 | 2.0% | 0.20%(+1.80)#54 | 4.2%(-2.20)#10,978 |
| 55. | 74959 | 1.9% | 0.20%(+1.70)#55 | 4.2%(-2.30)#11,080 |
| 56. | 73029 | 1.9% | 0.20%(+1.70)#56 | 4.2%(-2.30)#11,144 |
| 57. | 73759 | 1.8% | 0.20%(+1.60)#57 | 4.2%(-2.40)#11,312 |
| 58. | 74759 | 1.8% | 0.20%(+1.60)#58 | 4.2%(-2.40)#11,315 |
| 59. | 73718 | 1.8% | 0.20%(+1.60)#59 | 4.2%(-2.40)#11,328 |
| 60. | 73530 | 1.8% | 0.20%(+1.60)#60 | 4.2%(-2.40)#11,329 |
| 61. | 74604 | 1.7% | 0.20%(+1.50)#61 | 4.2%(-2.50)#11,377 |
| 62. | 73048 | 1.7% | 0.20%(+1.50)#62 | 4.2%(-2.50)#11,439 |
| 63. | 73038 | 1.7% | 0.20%(+1.50)#63 | 4.2%(-2.50)#11,453 |
| 64. | 73566 | 1.7% | 0.20%(+1.50)#64 | 4.2%(-2.50)#11,458 |
| 65. | 74766 | 1.7% | 0.20%(+1.50)#65 | 4.2%(-2.50)#11,472 |
| 66. | 74523 | 1.6% | 0.20%(+1.40)#66 | 4.2%(-2.60)#11,562 |
| 67. | 73529 | 1.6% | 0.20%(+1.40)#67 | 4.2%(-2.60)#11,573 |
| 68. | 74435 | 1.6% | 0.20%(+1.40)#68 | 4.2%(-2.60)#11,590 |
| 69. | 74932 | 1.6% | 0.20%(+1.40)#69 | 4.2%(-2.60)#11,601 |
| 70. | 74727 | 1.6% | 0.20%(+1.40)#70 | 4.2%(-2.60)#11,613 |
| 71. | 73531 | 1.6% | 0.20%(+1.40)#71 | 4.2%(-2.60)#11,673 |
| 72. | 73481 | 1.4% | 0.20%(+1.20)#72 | 4.2%(-2.80)#12,010 |
| 73. | 74427 | 1.3% | 0.20%(+1.10)#73 | 4.2%(-2.90)#12,203 |
| 74. | 74867 | 1.3% | 0.20%(+1.10)#74 | 4.2%(-2.90)#12,235 |
| 75. | 74060 | 1.3% | 0.20%(+1.10)#75 | 4.2%(-2.90)#12,239 |
| 76. | 73032 | 1.3% | 0.20%(+1.10)#76 | 4.2%(-2.90)#12,249 |
| 77. | 74728 | 1.2% | 0.20%(+1.000)#77 | 4.2%(-3.00)#12,322 |
| 78. | 73005 | 1.2% | 0.20%(+1.000)#78 | 4.2%(-3.00)#12,329 |
| 79. | 73047 | 1.2% | 0.20%(+1.000)#79 | 4.2%(-3.00)#12,344 |
| 80. | 74062 | 1.2% | 0.20%(+1.000)#80 | 4.2%(-3.00)#12,433 |
| 81. | 74562 | 1.2% | 0.20%(+1.000)#81 | 4.2%(-3.00)#12,438 |
| 82. | 73002 | 1.1% | 0.20%(+0.900)#82 | 4.2%(-3.10)#12,646 |
| 83. | 74650 | 1.1% | 0.20%(+0.900)#83 | 4.2%(-3.10)#12,667 |
| 84. | 73053 | 1.0% | 0.20%(+0.800)#84 | 4.2%(-3.20)#12,911 |
| 85. | 74075 | 0.90% | 0.20%(+0.700)#85 | 4.2%(-3.30)#12,982 |
| 86. | 74601 | 0.90% | 0.20%(+0.700)#86 | 4.2%(-3.30)#13,003 |
| 87. | 74338 | 0.90% | 0.20%(+0.700)#87 | 4.2%(-3.30)#13,090 |
| 88. | 73628 | 0.90% | 0.20%(+0.700)#88 | 4.2%(-3.30)#13,162 |
| 89. | 73004 | 0.90% | 0.20%(+0.700)#89 | 4.2%(-3.30)#13,189 |
| 90. | 73079 | 0.90% | 0.20%(+0.700)#90 | 4.2%(-3.30)#13,195 |
| 91. | 74871 | 0.80% | 0.20%(+0.600)#91 | 4.2%(-3.40)#13,453 |
| 92. | 73848 | 0.80% | 0.20%(+0.600)#92 | 4.2%(-3.40)#13,478 |
| 93. | 73768 | 0.80% | 0.20%(+0.600)#93 | 4.2%(-3.40)#13,480 |
| 94. | 74743 | 0.70% | 0.20%(+0.500)#94 | 4.2%(-3.50)#13,691 |
| 95. | 74462 | 0.70% | 0.20%(+0.500)#95 | 4.2%(-3.50)#13,701 |
| 96. | 73131 | 0.70% | 0.20%(+0.500)#96 | 4.2%(-3.50)#13,764 |
| 97. | 73573 | 0.70% | 0.20%(+0.500)#97 | 4.2%(-3.50)#13,790 |
| 98. | 73568 | 0.70% | 0.20%(+0.500)#98 | 4.2%(-3.50)#13,845 |
| 99. | 73755 | 0.70% | 0.20%(+0.500)#99 | 4.2%(-3.50)#13,853 |
| 100. | 73165 | 0.60% | 0.20%(+0.400)#100 | 4.2%(-3.60)#14,077 |
Common Questions
What are the Top 10 Zip Codes with the Highest Percentage of Households Heated by Fuel Oil / Kerosene in Oklahoma?
Top 10 Zip Codes with the Highest Percentage of Households Heated by Fuel Oil / Kerosene in Oklahoma are:
What zip code has the Highest Percentage of Households Heated by Fuel Oil / Kerosene in Oklahoma?
73758 has the Highest Percentage of Households Heated by Fuel Oil / Kerosene in Oklahoma with 38.4%.
What is the Percentage of Households Heated by Fuel Oil / Kerosene in the State of Oklahoma?
Percentage of Households Heated by Fuel Oil / Kerosene in Oklahoma is 0.20%.
What is the Percentage of Households Heated by Fuel Oil / Kerosene in the United States?
Percentage of Households Heated by Fuel Oil / Kerosene in the United States is 4.2%.