Zip Codes with the Most Immigrants from Peru in Oklahoma
RELATED REPORTS & OPTIONS
Peru
Oklahoma
Compare Zip Codes
Map of Zip Codes with the Most Immigrants from Peru in Oklahoma
0
250
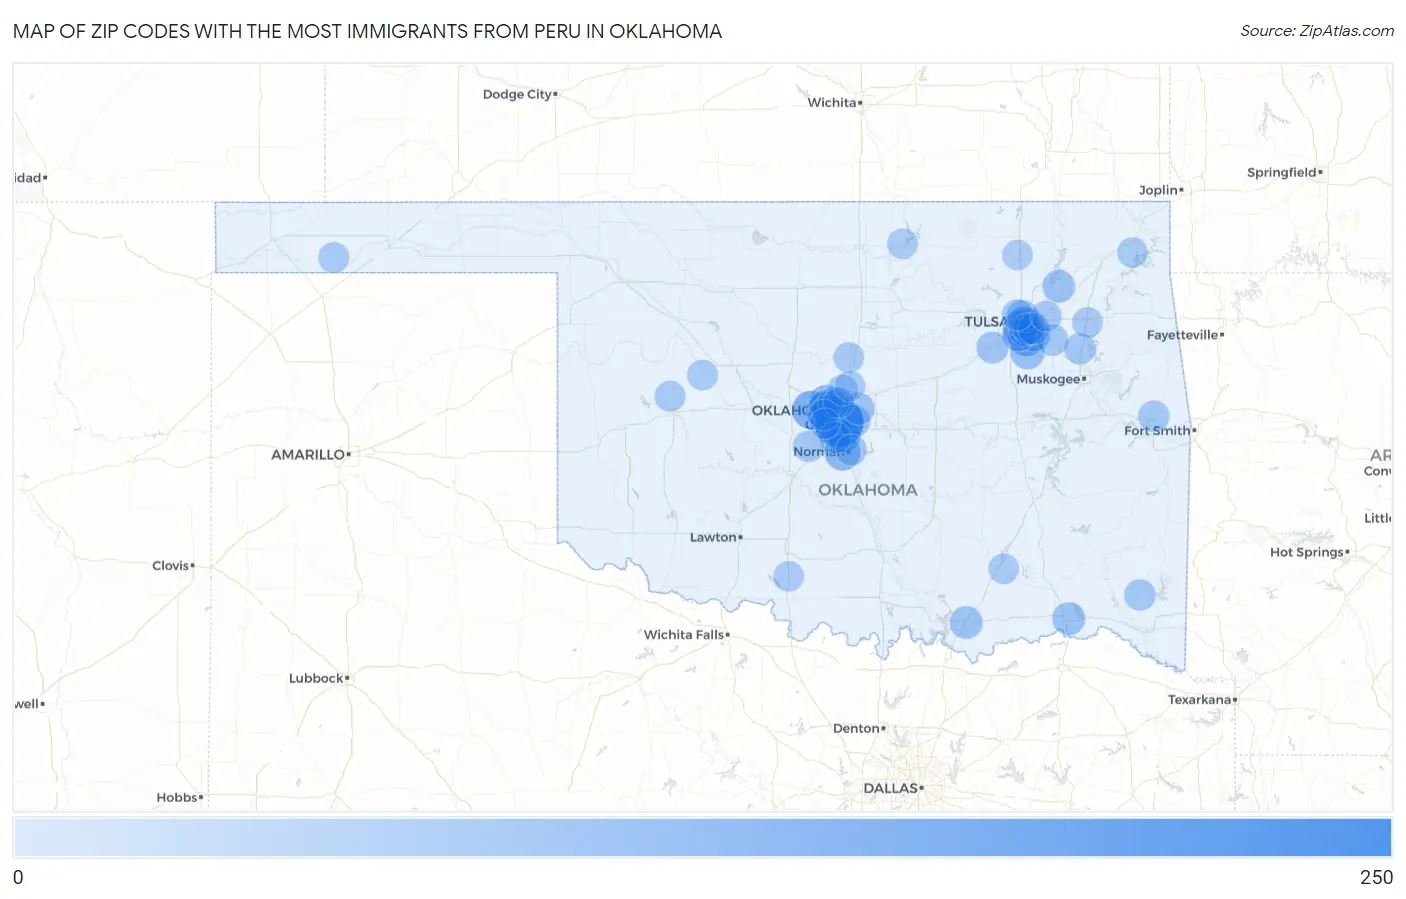
Zip Codes with the Most Immigrants from Peru in Oklahoma
| Zip Code | Peru | vs State | vs National | |
| 1. | 73109 | 207 | 1,321(15.67%)#1 | 461,322(0.04%)#509 |
| 2. | 73099 | 85 | 1,321(6.43%)#2 | 461,322(0.02%)#1,335 |
| 3. | 73008 | 80 | 1,321(6.06%)#3 | 461,322(0.02%)#1,426 |
| 4. | 74133 | 75 | 1,321(5.68%)#4 | 461,322(0.02%)#1,491 |
| 5. | 73119 | 75 | 1,321(5.68%)#5 | 461,322(0.02%)#1,497 |
| 6. | 74135 | 72 | 1,321(5.45%)#6 | 461,322(0.02%)#1,568 |
| 7. | 73072 | 60 | 1,321(4.54%)#7 | 461,322(0.01%)#1,812 |
| 8. | 73162 | 50 | 1,321(3.79%)#8 | 461,322(0.01%)#2,069 |
| 9. | 74129 | 40 | 1,321(3.03%)#9 | 461,322(0.01%)#2,401 |
| 10. | 74008 | 36 | 1,321(2.73%)#10 | 461,322(0.01%)#2,529 |
| 11. | 73132 | 33 | 1,321(2.50%)#11 | 461,322(0.01%)#2,652 |
| 12. | 73122 | 33 | 1,321(2.50%)#12 | 461,322(0.01%)#2,673 |
| 13. | 73160 | 32 | 1,321(2.42%)#13 | 461,322(0.01%)#2,681 |
| 14. | 74012 | 27 | 1,321(2.04%)#14 | 461,322(0.01%)#2,925 |
| 15. | 73110 | 27 | 1,321(2.04%)#15 | 461,322(0.01%)#2,945 |
| 16. | 74701 | 27 | 1,321(2.04%)#16 | 461,322(0.01%)#2,956 |
| 17. | 74743 | 27 | 1,321(2.04%)#17 | 461,322(0.01%)#2,979 |
| 18. | 74136 | 26 | 1,321(1.97%)#18 | 461,322(0.01%)#3,007 |
| 19. | 74017 | 24 | 1,321(1.82%)#19 | 461,322(0.01%)#3,142 |
| 20. | 74112 | 23 | 1,321(1.74%)#20 | 461,322(0.00%)#3,202 |
| 21. | 74145 | 21 | 1,321(1.59%)#21 | 461,322(0.00%)#3,343 |
| 22. | 74115 | 20 | 1,321(1.51%)#22 | 461,322(0.00%)#3,393 |
| 23. | 74066 | 19 | 1,321(1.44%)#23 | 461,322(0.00%)#3,450 |
| 24. | 73084 | 18 | 1,321(1.36%)#24 | 461,322(0.00%)#3,582 |
| 25. | 73170 | 15 | 1,321(1.14%)#25 | 461,322(0.00%)#3,777 |
| 26. | 74014 | 13 | 1,321(0.98%)#26 | 461,322(0.00%)#3,983 |
| 27. | 74146 | 13 | 1,321(0.98%)#27 | 461,322(0.00%)#4,031 |
| 28. | 73089 | 13 | 1,321(0.98%)#28 | 461,322(0.00%)#4,035 |
| 29. | 74134 | 12 | 1,321(0.91%)#29 | 461,322(0.00%)#4,130 |
| 30. | 74467 | 12 | 1,321(0.91%)#30 | 461,322(0.00%)#4,163 |
| 31. | 74728 | 12 | 1,321(0.91%)#31 | 461,322(0.00%)#4,174 |
| 32. | 74955 | 11 | 1,321(0.83%)#32 | 461,322(0.00%)#4,286 |
| 33. | 74110 | 10 | 1,321(0.76%)#33 | 461,322(0.00%)#4,404 |
| 34. | 73120 | 9 | 1,321(0.68%)#34 | 461,322(0.00%)#4,473 |
| 35. | 73127 | 8 | 1,321(0.61%)#35 | 461,322(0.00%)#4,618 |
| 36. | 73071 | 7 | 1,321(0.53%)#36 | 461,322(0.00%)#4,696 |
| 37. | 74015 | 6 | 1,321(0.45%)#37 | 461,322(0.00%)#4,900 |
| 38. | 73003 | 5 | 1,321(0.38%)#38 | 461,322(0.00%)#4,975 |
| 39. | 73620 | 5 | 1,321(0.38%)#39 | 461,322(0.00%)#5,031 |
| 40. | 73949 | 5 | 1,321(0.38%)#40 | 461,322(0.00%)#5,033 |
| 41. | 73114 | 4 | 1,321(0.30%)#41 | 461,322(0.00%)#5,080 |
| 42. | 73044 | 3 | 1,321(0.23%)#42 | 461,322(0.00%)#5,176 |
| 43. | 74525 | 3 | 1,321(0.23%)#43 | 461,322(0.00%)#5,198 |
| 44. | 73179 | 3 | 1,321(0.23%)#44 | 461,322(0.00%)#5,211 |
| 45. | 74337 | 3 | 1,321(0.23%)#45 | 461,322(0.00%)#5,214 |
| 46. | 73669 | 3 | 1,321(0.23%)#46 | 461,322(0.00%)#5,241 |
| 47. | 73034 | 2 | 1,321(0.15%)#47 | 461,322(0.00%)#5,257 |
| 48. | 74604 | 2 | 1,321(0.15%)#48 | 461,322(0.00%)#5,289 |
| 49. | 74331 | 2 | 1,321(0.15%)#49 | 461,322(0.00%)#5,303 |
| 50. | 74051 | 2 | 1,321(0.15%)#50 | 461,322(0.00%)#5,332 |
| 51. | 73529 | 1 | 1,321(0.08%)#51 | 461,322(0.00%)#5,393 |
Common Questions
What are the Top 10 Zip Codes with the Most Immigrants from Peru in Oklahoma?
Top 10 Zip Codes with the Most Immigrants from Peru in Oklahoma are:
What zip code has the Most Immigrants from Peru in Oklahoma?
73109 has the Most Immigrants from Peru in Oklahoma with 207.
What is the Total Immigrants from Peru in the State of Oklahoma?
Total Immigrants from Peru in Oklahoma is 1,321.
What is the Total Immigrants from Peru in the United States?
Total Immigrants from Peru in the United States is 461,322.