Zip Codes with the Highest Percentage of Households with Income Above $100,000 in Oklahoma
RELATED REPORTS & OPTIONS
Household Income | $100k+
Oklahoma
Compare Zip Codes
Map of Zip Codes with the Highest Percentage of Households with Income Above $100,000 in Oklahoma
30.0%
80.0%
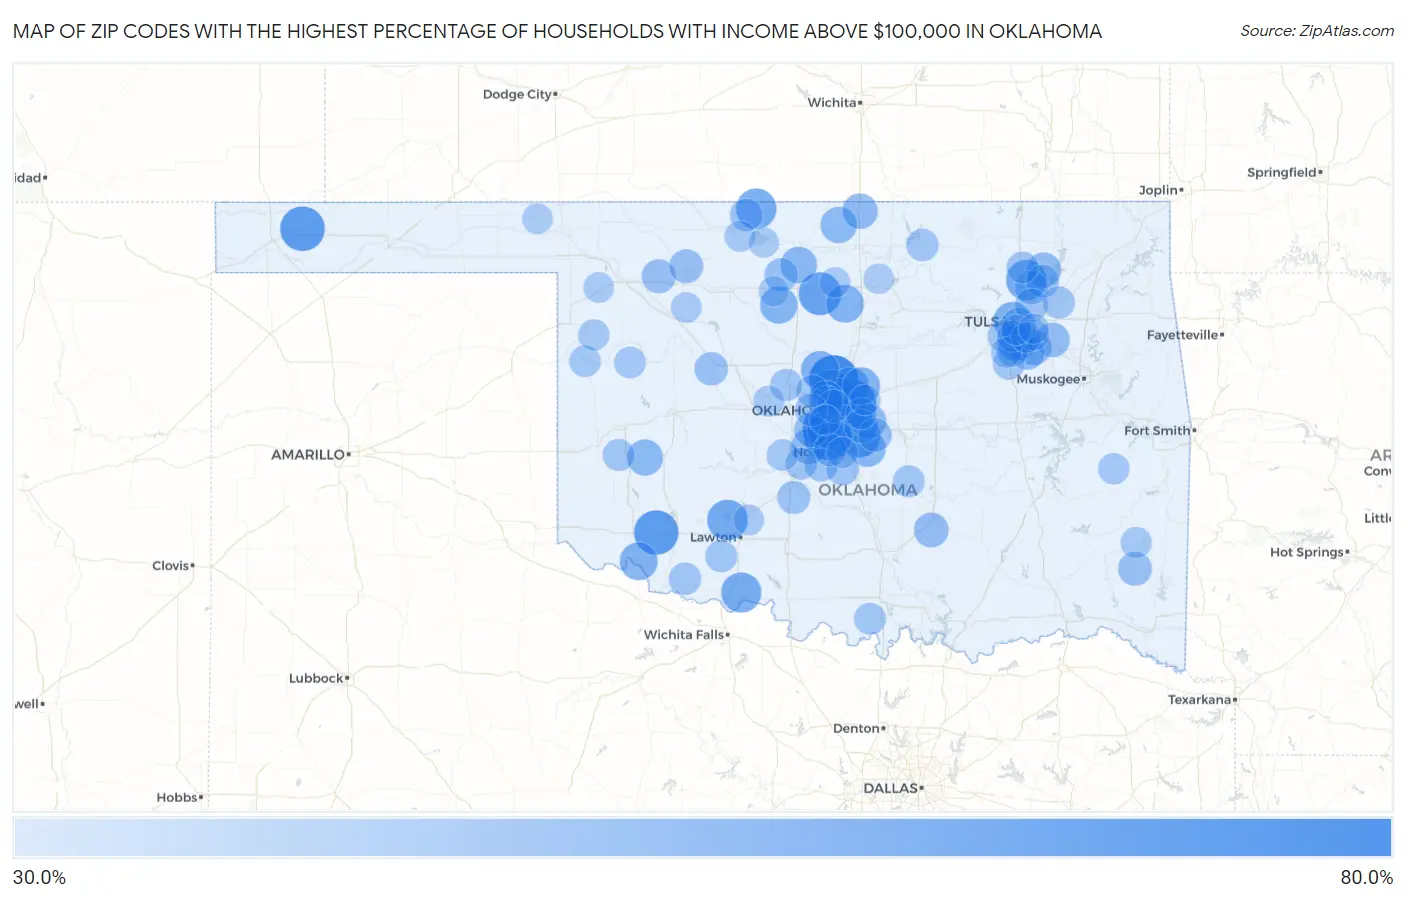
Zip Codes with the Highest Percentage of Households with Income Above $100,000 in Oklahoma
| Zip Code | Households with Income > $100k | vs State | vs National | |
| 1. | 73025 | 77.2% | 27.9%(+49.3)#1 | 37.3%(+39.9)#457 |
| 2. | 73173 | 73.1% | 27.9%(+45.2)#2 | 37.3%(+35.8)#696 |
| 3. | 73151 | 72.6% | 27.9%(+44.7)#3 | 37.3%(+35.3)#734 |
| 4. | 73097 | 66.7% | 27.9%(+38.8)#4 | 37.3%(+29.4)#1,318 |
| 5. | 73947 | 66.5% | 27.9%(+38.6)#5 | 37.3%(+29.2)#1,345 |
| 6. | 73549 | 66.0% | 27.9%(+38.1)#6 | 37.3%(+28.7)#1,406 |
| 7. | 73165 | 62.3% | 27.9%(+34.4)#7 | 37.3%(+25.0)#1,959 |
| 8. | 73736 | 62.3% | 27.9%(+34.4)#8 | 37.3%(+25.0)#1,964 |
| 9. | 73131 | 61.6% | 27.9%(+33.7)#9 | 37.3%(+24.3)#2,068 |
| 10. | 73557 | 57.7% | 27.9%(+29.8)#10 | 37.3%(+20.4)#2,836 |
| 11. | 74082 | 57.2% | 27.9%(+29.3)#11 | 37.3%(+19.9)#2,937 |
| 12. | 73012 | 57.1% | 27.9%(+29.2)#12 | 37.3%(+19.8)#2,946 |
| 13. | 73719 | 57.1% | 27.9%(+29.2)#13 | 37.3%(+19.8)#2,965 |
| 14. | 73562 | 56.6% | 27.9%(+28.7)#14 | 37.3%(+19.3)#3,082 |
| 15. | 73013 | 53.3% | 27.9%(+25.4)#15 | 37.3%(+16.0)#3,878 |
| 16. | 74103 | 52.9% | 27.9%(+25.0)#16 | 37.3%(+15.6)#4,004 |
| 17. | 73034 | 52.1% | 27.9%(+24.2)#17 | 37.3%(+14.8)#4,208 |
| 18. | 73016 | 52.1% | 27.9%(+24.2)#18 | 37.3%(+14.8)#4,222 |
| 19. | 73539 | 51.9% | 27.9%(+24.0)#19 | 37.3%(+14.6)#4,282 |
| 20. | 73757 | 51.6% | 27.9%(+23.7)#20 | 37.3%(+14.3)#4,385 |
| 21. | 73007 | 51.2% | 27.9%(+23.3)#21 | 37.3%(+13.9)#4,493 |
| 22. | 73735 | 50.8% | 27.9%(+22.9)#22 | 37.3%(+13.5)#4,615 |
| 23. | 73179 | 49.8% | 27.9%(+21.9)#23 | 37.3%(+12.5)#4,932 |
| 24. | 74137 | 49.7% | 27.9%(+21.8)#24 | 37.3%(+12.4)#4,951 |
| 25. | 73753 | 48.7% | 27.9%(+20.8)#25 | 37.3%(+11.4)#5,281 |
| 26. | 73026 | 48.5% | 27.9%(+20.6)#26 | 37.3%(+11.2)#5,324 |
| 27. | 74636 | 48.3% | 27.9%(+20.4)#27 | 37.3%(+11.0)#5,408 |
| 28. | 74037 | 48.1% | 27.9%(+20.2)#28 | 37.3%(+10.8)#5,460 |
| 29. | 73664 | 47.9% | 27.9%(+20.0)#29 | 37.3%(+10.6)#5,552 |
| 30. | 73089 | 46.6% | 27.9%(+18.7)#30 | 37.3%(+9.30)#5,978 |
| 31. | 74632 | 46.5% | 27.9%(+18.6)#31 | 37.3%(+9.20)#6,034 |
| 32. | 74011 | 46.2% | 27.9%(+18.3)#32 | 37.3%(+8.90)#6,118 |
| 33. | 73169 | 46.2% | 27.9%(+18.3)#33 | 37.3%(+8.90)#6,136 |
| 34. | 73020 | 46.0% | 27.9%(+18.1)#34 | 37.3%(+8.70)#6,204 |
| 35. | 74080 | 45.2% | 27.9%(+17.3)#35 | 37.3%(+7.90)#6,557 |
| 36. | 73170 | 45.0% | 27.9%(+17.1)#36 | 37.3%(+7.70)#6,615 |
| 37. | 74843 | 44.8% | 27.9%(+16.9)#37 | 37.3%(+7.50)#6,733 |
| 38. | 74014 | 44.6% | 27.9%(+16.7)#38 | 37.3%(+7.30)#6,769 |
| 39. | 74008 | 44.6% | 27.9%(+16.7)#39 | 37.3%(+7.30)#6,772 |
| 40. | 73064 | 44.3% | 27.9%(+16.4)#40 | 37.3%(+7.00)#6,891 |
| 41. | 74114 | 44.2% | 27.9%(+16.3)#41 | 37.3%(+6.90)#6,926 |
| 42. | 73852 | 43.4% | 27.9%(+15.5)#42 | 37.3%(+6.10)#7,262 |
| 43. | 73860 | 43.2% | 27.9%(+15.3)#43 | 37.3%(+5.90)#7,359 |
| 44. | 74722 | 43.1% | 27.9%(+15.2)#44 | 37.3%(+5.80)#7,425 |
| 45. | 73727 | 42.6% | 27.9%(+14.7)#45 | 37.3%(+5.30)#7,657 |
| 46. | 73142 | 42.5% | 27.9%(+14.6)#46 | 37.3%(+5.20)#7,677 |
| 47. | 73150 | 42.5% | 27.9%(+14.6)#47 | 37.3%(+5.20)#7,688 |
| 48. | 73162 | 42.3% | 27.9%(+14.4)#48 | 37.3%(+5.00)#7,760 |
| 49. | 74857 | 42.3% | 27.9%(+14.4)#49 | 37.3%(+5.00)#7,771 |
| 50. | 73646 | 42.2% | 27.9%(+14.3)#50 | 37.3%(+4.90)#7,834 |
| 51. | 74021 | 41.6% | 27.9%(+13.7)#51 | 37.3%(+4.30)#8,077 |
| 52. | 73116 | 41.6% | 27.9%(+13.7)#52 | 37.3%(+4.30)#8,082 |
| 53. | 74053 | 41.3% | 27.9%(+13.4)#53 | 37.3%(+4.00)#8,238 |
| 54. | 74055 | 41.2% | 27.9%(+13.3)#54 | 37.3%(+3.90)#8,279 |
| 55. | 73010 | 41.2% | 27.9%(+13.3)#55 | 37.3%(+3.90)#8,294 |
| 56. | 73093 | 41.1% | 27.9%(+13.2)#56 | 37.3%(+3.80)#8,354 |
| 57. | 73067 | 41.1% | 27.9%(+13.2)#57 | 37.3%(+3.80)#8,365 |
| 58. | 73065 | 40.7% | 27.9%(+12.8)#58 | 37.3%(+3.40)#8,559 |
| 59. | 73722 | 40.4% | 27.9%(+12.5)#59 | 37.3%(+3.10)#8,733 |
| 60. | 73099 | 40.3% | 27.9%(+12.4)#60 | 37.3%(+3.00)#8,740 |
| 61. | 74019 | 40.1% | 27.9%(+12.2)#61 | 37.3%(+2.80)#8,842 |
| 62. | 73078 | 40.1% | 27.9%(+12.2)#62 | 37.3%(+2.80)#8,847 |
| 63. | 73551 | 40.0% | 27.9%(+12.1)#63 | 37.3%(+2.70)#8,943 |
| 64. | 74131 | 39.9% | 27.9%(+12.0)#64 | 37.3%(+2.60)#8,983 |
| 65. | 74633 | 39.8% | 27.9%(+11.9)#65 | 37.3%(+2.50)#9,050 |
| 66. | 73762 | 39.4% | 27.9%(+11.5)#66 | 37.3%(+2.10)#9,244 |
| 67. | 73540 | 39.0% | 27.9%(+11.1)#67 | 37.3%(+1.70)#9,453 |
| 68. | 74061 | 38.9% | 27.9%(+11.0)#68 | 37.3%(+1.60)#9,484 |
| 69. | 74826 | 38.9% | 27.9%(+11.0)#69 | 37.3%(+1.60)#9,491 |
| 70. | 73627 | 38.9% | 27.9%(+11.0)#70 | 37.3%(+1.60)#9,501 |
| 71. | 74047 | 38.8% | 27.9%(+10.9)#71 | 37.3%(+1.50)#9,526 |
| 72. | 73453 | 38.8% | 27.9%(+10.9)#72 | 37.3%(+1.50)#9,554 |
| 73. | 73004 | 38.6% | 27.9%(+10.7)#73 | 37.3%(+1.30)#9,662 |
| 74. | 73654 | 38.3% | 27.9%(+10.4)#74 | 37.3%(+1.000)#9,846 |
| 75. | 74033 | 38.1% | 27.9%(+10.2)#75 | 37.3%(+0.800)#9,932 |
| 76. | 73638 | 38.1% | 27.9%(+10.2)#76 | 37.3%(+0.800)#9,965 |
| 77. | 73079 | 38.0% | 27.9%(+10.1)#77 | 37.3%(+0.700)#10,022 |
| 78. | 74943 | 37.8% | 27.9%(+9.90)#78 | 37.3%(+0.500)#10,132 |
| 79. | 73066 | 37.7% | 27.9%(+9.80)#79 | 37.3%(+0.400)#10,186 |
| 80. | 73832 | 37.6% | 27.9%(+9.70)#80 | 37.3%(+0.300)#10,230 |
| 81. | 74549 | 37.5% | 27.9%(+9.60)#81 | 37.3%(+0.200)#10,304 |
| 82. | 73072 | 37.4% | 27.9%(+9.50)#82 | 37.3%(+0.100)#10,321 |
| 83. | 74012 | 37.2% | 27.9%(+9.30)#83 | 37.3%(-0.100)#10,409 |
| 84. | 73728 | 36.9% | 27.9%(+9.00)#84 | 37.3%(-0.400)#10,656 |
| 85. | 73014 | 36.8% | 27.9%(+8.90)#85 | 37.3%(-0.500)#10,723 |
| 86. | 74132 | 36.7% | 27.9%(+8.80)#86 | 37.3%(-0.600)#10,750 |
| 87. | 73049 | 36.7% | 27.9%(+8.80)#87 | 37.3%(-0.600)#10,756 |
| 88. | 74041 | 36.4% | 27.9%(+8.50)#88 | 37.3%(-0.900)#10,935 |
| 89. | 73538 | 36.3% | 27.9%(+8.40)#89 | 37.3%(-1.00)#10,989 |
| 90. | 73128 | 36.3% | 27.9%(+8.40)#90 | 37.3%(-1.00)#10,990 |
| 91. | 73738 | 36.2% | 27.9%(+8.30)#91 | 37.3%(-1.10)#11,057 |
| 92. | 73838 | 36.2% | 27.9%(+8.30)#92 | 37.3%(-1.10)#11,061 |
| 93. | 74133 | 36.1% | 27.9%(+8.20)#93 | 37.3%(-1.20)#11,069 |
| 94. | 73840 | 36.1% | 27.9%(+8.20)#94 | 37.3%(-1.20)#11,111 |
| 95. | 73844 | 36.0% | 27.9%(+8.10)#95 | 37.3%(-1.30)#11,173 |
| 96. | 74105 | 35.9% | 27.9%(+8.00)#96 | 37.3%(-1.40)#11,192 |
| 97. | 74651 | 35.8% | 27.9%(+7.90)#97 | 37.3%(-1.50)#11,303 |
| 98. | 73754 | 35.7% | 27.9%(+7.80)#98 | 37.3%(-1.60)#11,347 |
| 99. | 74134 | 35.6% | 27.9%(+7.70)#99 | 37.3%(-1.70)#11,379 |
| 100. | 73749 | 35.6% | 27.9%(+7.70)#100 | 37.3%(-1.70)#11,416 |
Common Questions
What are the Top 10 Zip Codes with the Highest Percentage of Households with Income Above $100,000 in Oklahoma?
Top 10 Zip Codes with the Highest Percentage of Households with Income Above $100,000 in Oklahoma are:
What zip code has the Highest Percentage of Households with Income Above $100,000 in Oklahoma?
73025 has the Highest Percentage of Households with Income Above $100,000 in Oklahoma with 77.2%.
What is the Percentage of Households with Income Above $100,000 in the State of Oklahoma?
Percentage of Households with Income Above $100,000 in Oklahoma is 27.9%.
What is the Percentage of Households with Income Above $100,000 in the United States?
Percentage of Households with Income Above $100,000 in the United States is 37.3%.