Zip Codes with the Highest Percentage of Population Employed in Health Care & Social Assistance in Oklahoma
RELATED REPORTS & OPTIONS
Health Care & Social Assistance
Oklahoma
Compare Zip Codes
Map of Zip Codes with the Highest Percentage of Population Employed in Health Care & Social Assistance in Oklahoma
10.0%
60.0%
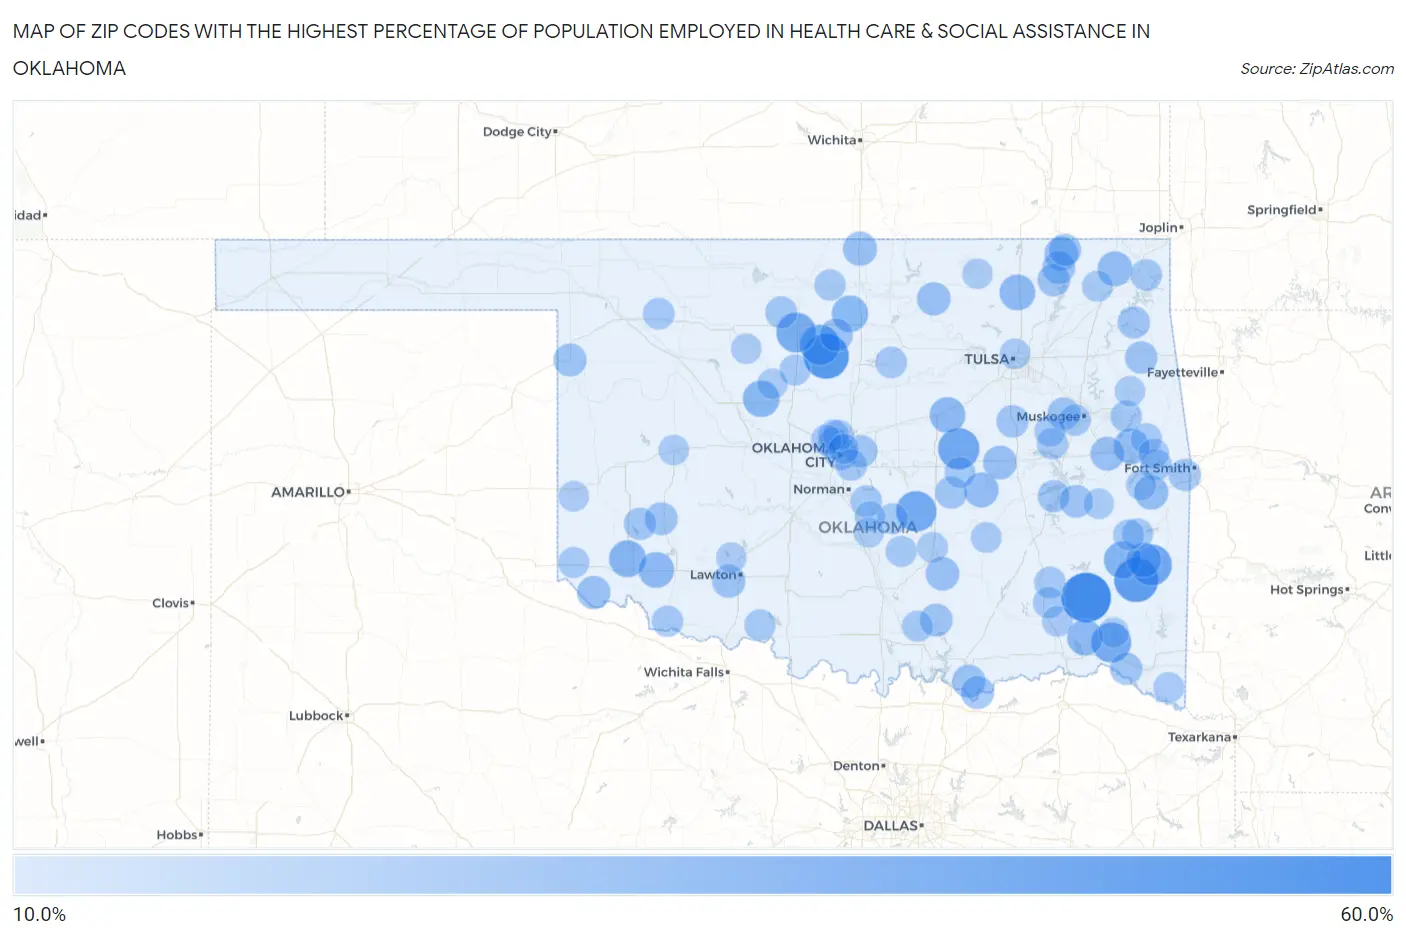
Zip Codes with the Highest Percentage of Population Employed in Health Care & Social Assistance in Oklahoma
| Zip Code | % Employed | vs State | vs National | |
| 1. | 74567 | 52.9% | 13.5% (+39.4)#1 | 13.9% (+39.0)#190 |
| 2. | 73056 | 44.8% | 13.5% (+31.3)#2 | 13.9% (+30.9)#303 |
| 3. | 74549 | 42.9% | 13.5% (+29.3)#3 | 13.9% (+28.9)#334 |
| 4. | 74829 | 37.5% | 13.5% (+24.0)#4 | 13.9% (+23.6)#471 |
| 5. | 74949 | 37.3% | 13.5% (+23.8)#5 | 13.9% (+23.4)#482 |
| 6. | 74866 | 35.7% | 13.5% (+22.2)#6 | 13.9% (+21.8)#558 |
| 7. | 73733 | 35.2% | 13.5% (+21.7)#7 | 13.9% (+21.2)#587 |
| 8. | 74755 | 34.8% | 13.5% (+21.3)#8 | 13.9% (+20.8)#610 |
| 9. | 73705 | 34.6% | 13.5% (+21.1)#9 | 13.9% (+20.7)#617 |
| 10. | 74571 | 29.8% | 13.5% (+16.3)#10 | 13.9% (+15.9)#956 |
| 11. | 73556 | 29.1% | 13.5% (+15.6)#11 | 13.9% (+15.2)#1,035 |
| 12. | 73764 | 28.9% | 13.5% (+15.4)#12 | 13.9% (+15.0)#1,055 |
| 13. | 74630 | 28.2% | 13.5% (+14.7)#13 | 13.9% (+14.2)#1,153 |
| 14. | 73549 | 27.3% | 13.5% (+13.7)#14 | 13.9% (+13.3)#1,292 |
| 15. | 74760 | 27.3% | 13.5% (+13.7)#15 | 13.9% (+13.3)#1,297 |
| 16. | 74051 | 27.1% | 13.5% (+13.5)#16 | 13.9% (+13.1)#1,332 |
| 17. | 74046 | 27.0% | 13.5% (+13.5)#17 | 13.9% (+13.0)#1,343 |
| 18. | 74962 | 26.2% | 13.5% (+12.7)#18 | 13.9% (+12.2)#1,491 |
| 19. | 74577 | 25.5% | 13.5% (+11.9)#19 | 13.9% (+11.5)#1,624 |
| 20. | 74333 | 25.3% | 13.5% (+11.7)#20 | 13.9% (+11.3)#1,672 |
| 21. | 74883 | 25.2% | 13.5% (+11.7)#21 | 13.9% (+11.3)#1,688 |
| 22. | 74930 | 24.1% | 13.5% (+10.5)#22 | 13.9% (+10.1)#1,974 |
| 23. | 74632 | 23.9% | 13.5% (+10.4)#23 | 13.9% (+10.0)#2,008 |
| 24. | 74470 | 23.8% | 13.5% (+10.2)#24 | 13.9% (+9.84)#2,056 |
| 25. | 74042 | 23.5% | 13.5% (+10.00)#25 | 13.9% (+9.59)#2,139 |
| 26. | 74880 | 23.4% | 13.5% (+9.90)#26 | 13.9% (+9.50)#2,171 |
| 27. | 74637 | 23.2% | 13.5% (+9.67)#27 | 13.9% (+9.27)#2,274 |
| 28. | 74842 | 23.1% | 13.5% (+9.54)#28 | 13.9% (+9.14)#2,322 |
| 29. | 73537 | 22.8% | 13.5% (+9.25)#29 | 13.9% (+8.84)#2,417 |
| 30. | 74720 | 22.6% | 13.5% (+9.05)#30 | 13.9% (+8.64)#2,529 |
| 31. | 73505 | 22.6% | 13.5% (+9.03)#31 | 13.9% (+8.63)#2,537 |
| 32. | 74747 | 22.3% | 13.5% (+8.78)#32 | 13.9% (+8.37)#2,642 |
| 33. | 73858 | 22.2% | 13.5% (+8.71)#33 | 13.9% (+8.30)#2,667 |
| 34. | 73730 | 22.2% | 13.5% (+8.66)#34 | 13.9% (+8.26)#2,705 |
| 35. | 74027 | 21.9% | 13.5% (+8.40)#35 | 13.9% (+8.00)#2,834 |
| 36. | 74561 | 21.9% | 13.5% (+8.37)#36 | 13.9% (+7.97)#2,847 |
| 37. | 73651 | 21.8% | 13.5% (+8.29)#37 | 13.9% (+7.89)#2,897 |
| 38. | 73460 | 21.7% | 13.5% (+8.16)#38 | 13.9% (+7.76)#2,954 |
| 39. | 74463 | 21.6% | 13.5% (+8.04)#39 | 13.9% (+7.63)#3,027 |
| 40. | 74048 | 21.4% | 13.5% (+7.89)#40 | 13.9% (+7.48)#3,108 |
| 41. | 74359 | 21.2% | 13.5% (+7.68)#41 | 13.9% (+7.28)#3,227 |
| 42. | 73104 | 21.1% | 13.5% (+7.58)#42 | 13.9% (+7.18)#3,304 |
| 43. | 74884 | 21.0% | 13.5% (+7.43)#43 | 13.9% (+7.02)#3,399 |
| 44. | 74072 | 20.9% | 13.5% (+7.40)#44 | 13.9% (+7.00)#3,421 |
| 45. | 73655 | 20.9% | 13.5% (+7.40)#45 | 13.9% (+6.99)#3,423 |
| 46. | 74456 | 20.9% | 13.5% (+7.40)#46 | 13.9% (+6.99)#3,426 |
| 47. | 74342 | 20.9% | 13.5% (+7.39)#47 | 13.9% (+6.99)#3,432 |
| 48. | 74736 | 20.7% | 13.5% (+7.13)#48 | 13.9% (+6.73)#3,606 |
| 49. | 74901 | 20.6% | 13.5% (+7.10)#49 | 13.9% (+6.70)#3,630 |
| 50. | 74425 | 20.6% | 13.5% (+7.08)#50 | 13.9% (+6.68)#3,643 |
| 51. | 73066 | 20.5% | 13.5% (+7.00)#51 | 13.9% (+6.59)#3,697 |
| 52. | 73727 | 20.3% | 13.5% (+6.81)#52 | 13.9% (+6.40)#3,834 |
| 53. | 73116 | 19.7% | 13.5% (+6.20)#53 | 13.9% (+5.80)#4,283 |
| 54. | 73068 | 19.7% | 13.5% (+6.17)#54 | 13.9% (+5.76)#4,311 |
| 55. | 74401 | 19.7% | 13.5% (+6.12)#55 | 13.9% (+5.72)#4,356 |
| 56. | 73852 | 19.6% | 13.5% (+6.05)#56 | 13.9% (+5.65)#4,413 |
| 57. | 74077 | 19.5% | 13.5% (+6.01)#57 | 13.9% (+5.61)#4,457 |
| 58. | 74343 | 19.5% | 13.5% (+5.99)#58 | 13.9% (+5.58)#4,487 |
| 59. | 74540 | 19.5% | 13.5% (+5.98)#59 | 13.9% (+5.58)#4,494 |
| 60. | 73135 | 19.5% | 13.5% (+5.93)#60 | 13.9% (+5.53)#4,544 |
| 61. | 74451 | 19.4% | 13.5% (+5.86)#61 | 13.9% (+5.45)#4,613 |
| 62. | 74936 | 19.3% | 13.5% (+5.77)#62 | 13.9% (+5.37)#4,696 |
| 63. | 74557 | 19.2% | 13.5% (+5.66)#63 | 13.9% (+5.26)#4,800 |
| 64. | 73530 | 19.1% | 13.5% (+5.59)#64 | 13.9% (+5.19)#4,856 |
| 65. | 74872 | 18.9% | 13.5% (+5.38)#65 | 13.9% (+4.97)#5,093 |
| 66. | 73568 | 18.9% | 13.5% (+5.34)#66 | 13.9% (+4.93)#5,121 |
| 67. | 74428 | 18.8% | 13.5% (+5.29)#67 | 13.9% (+4.89)#5,175 |
| 68. | 74643 | 18.8% | 13.5% (+5.27)#68 | 13.9% (+4.87)#5,203 |
| 69. | 73447 | 18.6% | 13.5% (+5.06)#69 | 13.9% (+4.66)#5,431 |
| 70. | 74945 | 18.5% | 13.5% (+4.99)#70 | 13.9% (+4.58)#5,523 |
| 71. | 74837 | 18.5% | 13.5% (+4.99)#71 | 13.9% (+4.58)#5,525 |
| 72. | 74301 | 18.5% | 13.5% (+4.98)#72 | 13.9% (+4.58)#5,530 |
| 73. | 74878 | 18.5% | 13.5% (+4.96)#73 | 13.9% (+4.56)#5,549 |
| 74. | 74422 | 18.5% | 13.5% (+4.92)#74 | 13.9% (+4.52)#5,608 |
| 75. | 73742 | 18.4% | 13.5% (+4.87)#75 | 13.9% (+4.47)#5,678 |
| 76. | 73550 | 18.4% | 13.5% (+4.85)#76 | 13.9% (+4.44)#5,706 |
| 77. | 74966 | 18.4% | 13.5% (+4.84)#77 | 13.9% (+4.44)#5,710 |
| 78. | 74942 | 18.4% | 13.5% (+4.83)#78 | 13.9% (+4.43)#5,726 |
| 79. | 74820 | 18.3% | 13.5% (+4.78)#79 | 13.9% (+4.38)#5,792 |
| 80. | 74523 | 18.2% | 13.5% (+4.67)#80 | 13.9% (+4.27)#5,931 |
| 81. | 74740 | 18.2% | 13.5% (+4.63)#81 | 13.9% (+4.23)#5,983 |
| 82. | 74531 | 17.9% | 13.5% (+4.42)#82 | 13.9% (+4.01)#6,248 |
| 83. | 73013 | 17.9% | 13.5% (+4.32)#83 | 13.9% (+3.92)#6,385 |
| 84. | 73134 | 17.8% | 13.5% (+4.31)#84 | 13.9% (+3.90)#6,405 |
| 85. | 74106 | 17.8% | 13.5% (+4.30)#85 | 13.9% (+3.90)#6,407 |
| 86. | 73162 | 17.8% | 13.5% (+4.29)#86 | 13.9% (+3.88)#6,427 |
| 87. | 74955 | 17.8% | 13.5% (+4.28)#87 | 13.9% (+3.87)#6,445 |
| 88. | 74552 | 17.6% | 13.5% (+4.11)#88 | 13.9% (+3.71)#6,710 |
| 89. | 73645 | 17.6% | 13.5% (+4.09)#89 | 13.9% (+3.68)#6,753 |
| 90. | 73601 | 17.5% | 13.5% (+4.00)#90 | 13.9% (+3.59)#6,889 |
| 91. | 74056 | 17.5% | 13.5% (+3.99)#91 | 13.9% (+3.59)#6,893 |
| 92. | 73747 | 17.5% | 13.5% (+3.97)#92 | 13.9% (+3.56)#6,925 |
| 93. | 74464 | 17.5% | 13.5% (+3.96)#93 | 13.9% (+3.55)#6,941 |
| 94. | 73756 | 17.5% | 13.5% (+3.95)#94 | 13.9% (+3.55)#6,952 |
| 95. | 73507 | 17.5% | 13.5% (+3.92)#95 | 13.9% (+3.52)#6,993 |
| 96. | 73051 | 17.4% | 13.5% (+3.84)#96 | 13.9% (+3.43)#7,141 |
| 97. | 73111 | 17.3% | 13.5% (+3.80)#97 | 13.9% (+3.39)#7,199 |
| 98. | 73095 | 17.3% | 13.5% (+3.78)#98 | 13.9% (+3.37)#7,232 |
| 99. | 74941 | 17.3% | 13.5% (+3.77)#99 | 13.9% (+3.36)#7,243 |
| 100. | 74754 | 17.3% | 13.5% (+3.75)#100 | 13.9% (+3.34)#7,267 |
Common Questions
What are the Top 10 Zip Codes with the Highest Percentage of Population Employed in Health Care & Social Assistance in Oklahoma?
Top 10 Zip Codes with the Highest Percentage of Population Employed in Health Care & Social Assistance in Oklahoma are:
What zip code has the Highest Percentage of Population Employed in Health Care & Social Assistance in Oklahoma?
74567 has the Highest Percentage of Population Employed in Health Care & Social Assistance in Oklahoma with 52.9%.
What is the Percentage of Population Employed in Health Care & Social Assistance in the State of Oklahoma?
Percentage of Population Employed in Health Care & Social Assistance in Oklahoma is 13.5%.
What is the Percentage of Population Employed in Health Care & Social Assistance in the United States?
Percentage of Population Employed in Health Care & Social Assistance in the United States is 13.9%.