Zip Codes with the Highest Percentage of Families with Income Below $10,000 in Oklahoma
RELATED REPORTS & OPTIONS
Family Income | $0-10k
Oklahoma
Compare Zip Codes
Map of Zip Codes with the Highest Percentage of Families with Income Below $10,000 in Oklahoma
0.0%
40.0%
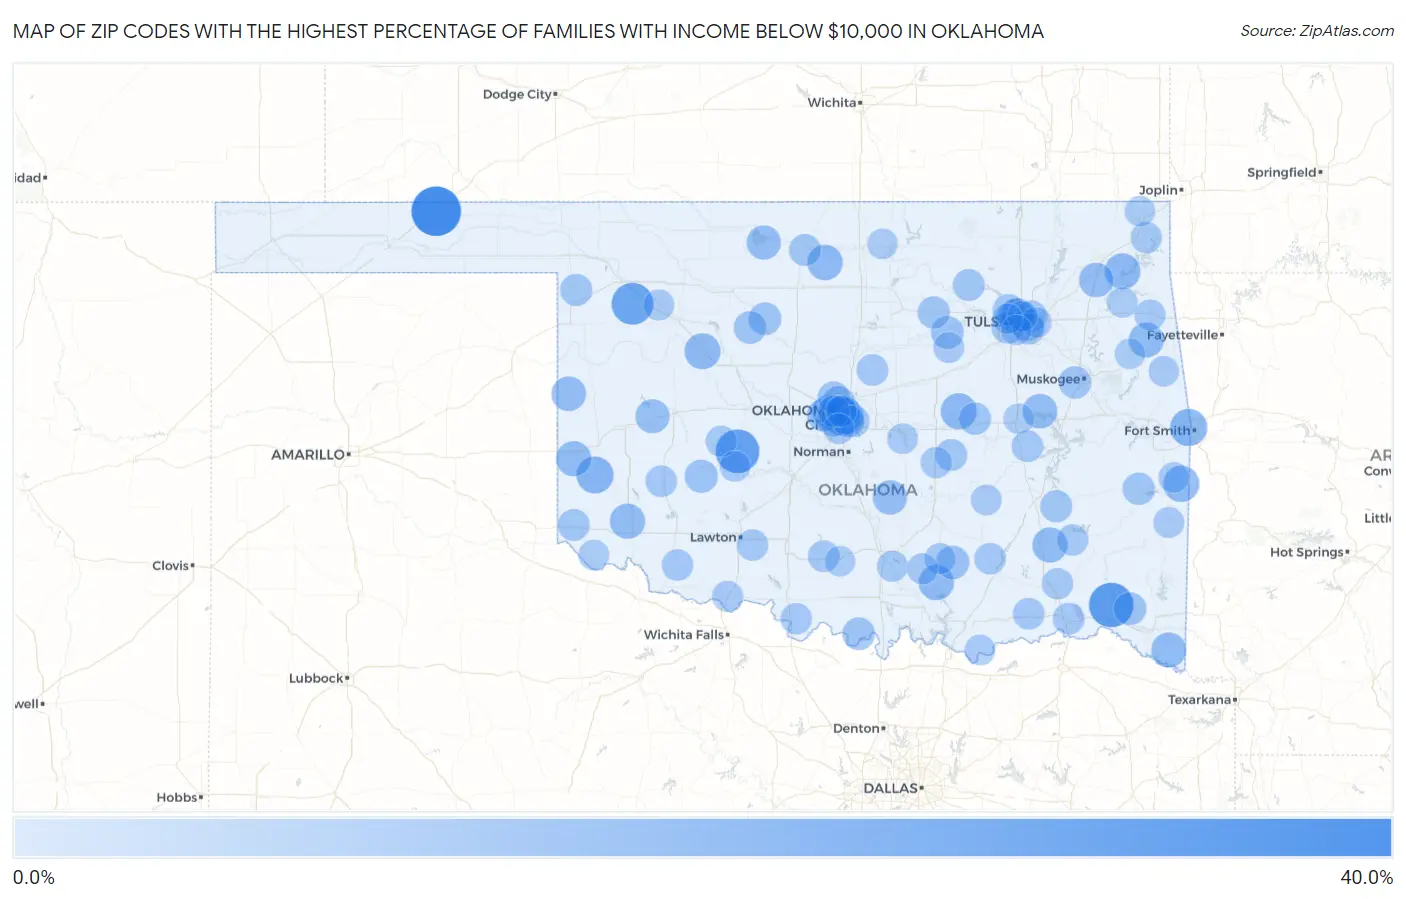
Zip Codes with the Highest Percentage of Families with Income Below $10,000 in Oklahoma
| Zip Code | Families with Income < $10k | vs State | vs National | |
| 1. | 73951 | 38.6% | 3.8% (+34.8)#1 | 3.1% (+35.5)#122 |
| 2. | 74755 | 30.0% | 3.8% (+26.2)#2 | 3.1% (+26.9)#197 |
| 3. | 73001 | 28.6% | 3.8% (+24.8)#3 | 3.1% (+25.5)#217 |
| 4. | 73857 | 25.4% | 3.8% (+21.6)#4 | 3.1% (+22.3)#293 |
| 5. | 73104 | 18.9% | 3.8% (+15.1)#5 | 3.1% (+15.8)#532 |
| 6. | 74946 | 17.6% | 3.8% (+13.8)#6 | 3.1% (+14.5)#620 |
| 7. | 73673 | 17.3% | 3.8% (+13.5)#7 | 3.1% (+14.2)#643 |
| 8. | 74947 | 16.0% | 3.8% (+12.2)#8 | 3.1% (+12.9)#754 |
| 9. | 74829 | 15.7% | 3.8% (+11.9)#9 | 3.1% (+12.6)#779 |
| 10. | 73658 | 15.6% | 3.8% (+11.8)#10 | 3.1% (+12.5)#794 |
| 11. | 74349 | 15.3% | 3.8% (+11.5)#11 | 3.1% (+12.2)#831 |
| 12. | 74640 | 14.9% | 3.8% (+11.1)#12 | 3.1% (+11.8)#877 |
| 13. | 73117 | 14.6% | 3.8% (+10.8)#13 | 3.1% (+11.5)#903 |
| 14. | 73460 | 14.6% | 3.8% (+10.8)#14 | 3.1% (+11.5)#904 |
| 15. | 73645 | 14.3% | 3.8% (+10.5)#15 | 3.1% (+11.2)#939 |
| 16. | 74540 | 14.3% | 3.8% (+10.5)#16 | 3.1% (+11.2)#946 |
| 17. | 73556 | 14.3% | 3.8% (+10.5)#17 | 3.1% (+11.2)#947 |
| 18. | 74740 | 13.9% | 3.8% (+10.1)#18 | 3.1% (+10.8)#987 |
| 19. | 74457 | 13.9% | 3.8% (+10.1)#19 | 3.1% (+10.8)#995 |
| 20. | 73660 | 13.3% | 3.8% (+9.50)#20 | 3.1% (+10.2)#1,076 |
| 21. | 74438 | 13.3% | 3.8% (+9.50)#21 | 3.1% (+10.2)#1,078 |
| 22. | 74106 | 13.2% | 3.8% (+9.40)#22 | 3.1% (+10.1)#1,087 |
| 23. | 74330 | 13.2% | 3.8% (+9.40)#23 | 3.1% (+10.1)#1,094 |
| 24. | 74831 | 12.8% | 3.8% (+9.00)#24 | 3.1% (+9.70)#1,171 |
| 25. | 73749 | 12.6% | 3.8% (+8.80)#25 | 3.1% (+9.50)#1,206 |
| 26. | 73647 | 12.4% | 3.8% (+8.60)#26 | 3.1% (+9.30)#1,250 |
| 27. | 74530 | 11.7% | 3.8% (+7.90)#27 | 3.1% (+8.60)#1,414 |
| 28. | 73122 | 11.5% | 3.8% (+7.70)#28 | 3.1% (+8.40)#1,450 |
| 29. | 74110 | 11.4% | 3.8% (+7.60)#29 | 3.1% (+8.30)#1,475 |
| 30. | 73108 | 11.2% | 3.8% (+7.40)#30 | 3.1% (+8.10)#1,533 |
| 31. | 73062 | 11.0% | 3.8% (+7.20)#31 | 3.1% (+7.90)#1,602 |
| 32. | 73127 | 10.8% | 3.8% (+7.00)#32 | 3.1% (+7.70)#1,648 |
| 33. | 74766 | 10.3% | 3.8% (+6.50)#33 | 3.1% (+7.20)#1,811 |
| 34. | 74052 | 10.2% | 3.8% (+6.40)#34 | 3.1% (+7.10)#1,854 |
| 35. | 73718 | 10.2% | 3.8% (+6.40)#35 | 3.1% (+7.10)#1,860 |
| 36. | 73114 | 10.1% | 3.8% (+6.30)#36 | 3.1% (+7.00)#1,868 |
| 37. | 73111 | 10.0% | 3.8% (+6.20)#37 | 3.1% (+6.90)#1,911 |
| 38. | 73763 | 10.0% | 3.8% (+6.20)#38 | 3.1% (+6.90)#1,922 |
| 39. | 73430 | 10.0% | 3.8% (+6.20)#39 | 3.1% (+6.90)#1,924 |
| 40. | 74401 | 9.9% | 3.8% (+6.10)#40 | 3.1% (+6.80)#1,953 |
| 41. | 74045 | 9.6% | 3.8% (+5.80)#41 | 3.1% (+6.50)#2,102 |
| 42. | 74859 | 9.5% | 3.8% (+5.70)#42 | 3.1% (+6.40)#2,116 |
| 43. | 74935 | 9.5% | 3.8% (+5.70)#43 | 3.1% (+6.40)#2,145 |
| 44. | 74107 | 9.2% | 3.8% (+5.40)#44 | 3.1% (+6.10)#2,248 |
| 45. | 73134 | 9.2% | 3.8% (+5.40)#45 | 3.1% (+6.10)#2,258 |
| 46. | 74547 | 9.2% | 3.8% (+5.40)#46 | 3.1% (+6.10)#2,265 |
| 47. | 73843 | 9.2% | 3.8% (+5.40)#47 | 3.1% (+6.10)#2,286 |
| 48. | 74129 | 8.9% | 3.8% (+5.10)#48 | 3.1% (+5.80)#2,405 |
| 49. | 74884 | 8.9% | 3.8% (+5.10)#49 | 3.1% (+5.80)#2,416 |
| 50. | 73766 | 8.9% | 3.8% (+5.10)#50 | 3.1% (+5.80)#2,434 |
| 51. | 74035 | 8.8% | 3.8% (+5.00)#51 | 3.1% (+5.70)#2,474 |
| 52. | 74126 | 8.7% | 3.8% (+4.90)#52 | 3.1% (+5.60)#2,514 |
| 53. | 73550 | 8.7% | 3.8% (+4.90)#53 | 3.1% (+5.60)#2,535 |
| 54. | 73110 | 8.6% | 3.8% (+4.80)#54 | 3.1% (+5.50)#2,558 |
| 55. | 73115 | 8.6% | 3.8% (+4.80)#55 | 3.1% (+5.50)#2,567 |
| 56. | 73058 | 8.6% | 3.8% (+4.80)#56 | 3.1% (+5.50)#2,623 |
| 57. | 74743 | 8.5% | 3.8% (+4.70)#57 | 3.1% (+5.40)#2,646 |
| 58. | 74116 | 8.5% | 3.8% (+4.70)#58 | 3.1% (+5.40)#2,661 |
| 59. | 73491 | 8.5% | 3.8% (+4.70)#59 | 3.1% (+5.40)#2,685 |
| 60. | 73112 | 8.4% | 3.8% (+4.60)#60 | 3.1% (+5.30)#2,707 |
| 61. | 74727 | 8.4% | 3.8% (+4.60)#61 | 3.1% (+5.30)#2,746 |
| 62. | 73651 | 8.3% | 3.8% (+4.50)#62 | 3.1% (+5.20)#2,796 |
| 63. | 74845 | 8.3% | 3.8% (+4.50)#63 | 3.1% (+5.20)#2,820 |
| 64. | 73501 | 8.2% | 3.8% (+4.40)#64 | 3.1% (+5.10)#2,844 |
| 65. | 74146 | 8.2% | 3.8% (+4.40)#65 | 3.1% (+5.10)#2,850 |
| 66. | 74556 | 8.2% | 3.8% (+4.40)#66 | 3.1% (+5.10)#2,892 |
| 67. | 73542 | 8.1% | 3.8% (+4.30)#67 | 3.1% (+5.00)#2,919 |
| 68. | 73565 | 8.1% | 3.8% (+4.30)#68 | 3.1% (+5.00)#2,935 |
| 69. | 74523 | 8.0% | 3.8% (+4.20)#69 | 3.1% (+4.90)#2,974 |
| 70. | 74536 | 7.9% | 3.8% (+4.10)#70 | 3.1% (+4.80)#3,056 |
| 71. | 74830 | 7.9% | 3.8% (+4.10)#71 | 3.1% (+4.80)#3,070 |
| 72. | 73105 | 7.7% | 3.8% (+3.90)#72 | 3.1% (+4.60)#3,140 |
| 73. | 74836 | 7.7% | 3.8% (+3.90)#73 | 3.1% (+4.60)#3,180 |
| 74. | 74343 | 7.6% | 3.8% (+3.80)#74 | 3.1% (+4.50)#3,236 |
| 75. | 73033 | 7.6% | 3.8% (+3.80)#75 | 3.1% (+4.50)#3,252 |
| 76. | 73032 | 7.5% | 3.8% (+3.70)#76 | 3.1% (+4.40)#3,327 |
| 77. | 74347 | 7.4% | 3.8% (+3.60)#77 | 3.1% (+4.30)#3,362 |
| 78. | 74856 | 7.4% | 3.8% (+3.60)#78 | 3.1% (+4.30)#3,379 |
| 79. | 73853 | 7.3% | 3.8% (+3.50)#79 | 3.1% (+4.20)#3,460 |
| 80. | 74030 | 7.2% | 3.8% (+3.40)#80 | 3.1% (+4.10)#3,502 |
| 81. | 74939 | 7.2% | 3.8% (+3.40)#81 | 3.1% (+4.10)#3,518 |
| 82. | 73531 | 7.2% | 3.8% (+3.40)#82 | 3.1% (+4.10)#3,531 |
| 83. | 73038 | 7.0% | 3.8% (+3.20)#83 | 3.1% (+3.90)#3,665 |
| 84. | 74531 | 7.0% | 3.8% (+3.20)#84 | 3.1% (+3.90)#3,673 |
| 85. | 74801 | 6.9% | 3.8% (+3.10)#85 | 3.1% (+3.80)#3,704 |
| 86. | 73139 | 6.9% | 3.8% (+3.10)#86 | 3.1% (+3.80)#3,707 |
| 87. | 74960 | 6.9% | 3.8% (+3.10)#87 | 3.1% (+3.80)#3,715 |
| 88. | 74108 | 6.9% | 3.8% (+3.10)#88 | 3.1% (+3.80)#3,722 |
| 89. | 74115 | 6.8% | 3.8% (+3.00)#89 | 3.1% (+3.70)#3,804 |
| 90. | 74953 | 6.8% | 3.8% (+3.00)#90 | 3.1% (+3.70)#3,820 |
| 91. | 74741 | 6.8% | 3.8% (+3.00)#91 | 3.1% (+3.70)#3,861 |
| 92. | 73537 | 6.8% | 3.8% (+3.00)#92 | 3.1% (+3.70)#3,871 |
| 93. | 74464 | 6.7% | 3.8% (+2.90)#93 | 3.1% (+3.60)#3,891 |
| 94. | 74431 | 6.7% | 3.8% (+2.90)#94 | 3.1% (+3.60)#3,959 |
| 95. | 74127 | 6.6% | 3.8% (+2.80)#95 | 3.1% (+3.50)#4,008 |
| 96. | 74365 | 6.6% | 3.8% (+2.80)#96 | 3.1% (+3.50)#4,033 |
| 97. | 73481 | 6.6% | 3.8% (+2.80)#97 | 3.1% (+3.50)#4,067 |
| 98. | 74105 | 6.5% | 3.8% (+2.70)#98 | 3.1% (+3.40)#4,107 |
| 99. | 74339 | 6.5% | 3.8% (+2.70)#99 | 3.1% (+3.40)#4,160 |
| 100. | 74601 | 6.4% | 3.8% (+2.60)#100 | 3.1% (+3.30)#4,222 |
Common Questions
What are the Top 10 Zip Codes with the Highest Percentage of Families with Income Below $10,000 in Oklahoma?
Top 10 Zip Codes with the Highest Percentage of Families with Income Below $10,000 in Oklahoma are:
What zip code has the Highest Percentage of Families with Income Below $10,000 in Oklahoma?
73951 has the Highest Percentage of Families with Income Below $10,000 in Oklahoma with 38.6%.
What is the Percentage of Families with Income Below $10,000 in the State of Oklahoma?
Percentage of Families with Income Below $10,000 in Oklahoma is 3.8%.
What is the Percentage of Families with Income Below $10,000 in the United States?
Percentage of Families with Income Below $10,000 in the United States is 3.1%.