Zip Codes with the Highest Percentage of Households Heated by Utility Gas in O Fallon, MO
RELATED REPORTS & OPTIONS
Utility Gas Heating
O Fallon
Compare Zip Codes
Map of Zip Codes with the Highest Percentage of Households Heated by Utility Gas in O Fallon
63.7%
73.3%
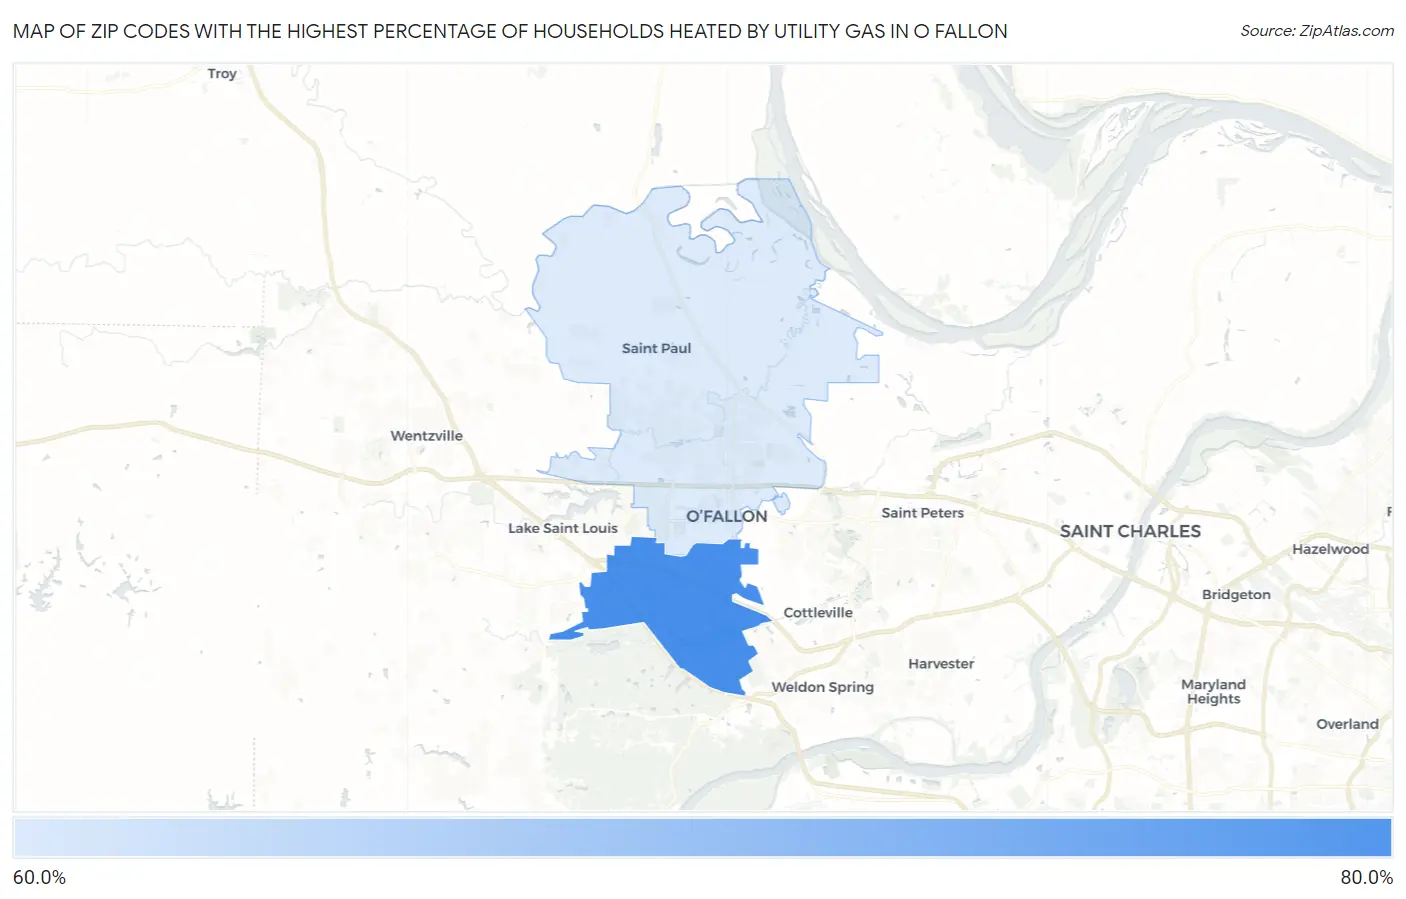
Zip Codes with the Highest Percentage of Households Heated by Utility Gas in O Fallon, MO
| Zip Code | Utility Gas Heating | vs State | vs National | |
| 1. | 63368 | 73.3% | 50.0%(+23.3)#74 | 47.1%(+26.2)#3,805 |
| 2. | 63366 | 63.7% | 50.0%(+13.7)#118 | 47.1%(+16.6)#6,337 |
1
Common Questions
What are the Top Zip Codes with the Highest Percentage of Households Heated by Utility Gas in O Fallon, MO?
Top Zip Codes with the Highest Percentage of Households Heated by Utility Gas in O Fallon, MO are:
What zip code has the Highest Percentage of Households Heated by Utility Gas in O Fallon, MO?
63368 has the Highest Percentage of Households Heated by Utility Gas in O Fallon, MO with 73.3%.
What is the Percentage of Households Heated by Utility Gas in O Fallon, MO?
Percentage of Households Heated by Utility Gas in O Fallon is 71.6%.
What is the Percentage of Households Heated by Utility Gas in Missouri?
Percentage of Households Heated by Utility Gas in Missouri is 50.0%.
What is the Percentage of Households Heated by Utility Gas in the United States?
Percentage of Households Heated by Utility Gas in the United States is 47.1%.