Zip Codes with the Highest Percentage of Population with a Degree in Liberal Arts and History in O Fallon, MO
RELATED REPORTS & OPTIONS
Liberal Arts and History
O Fallon
Compare Zip Codes
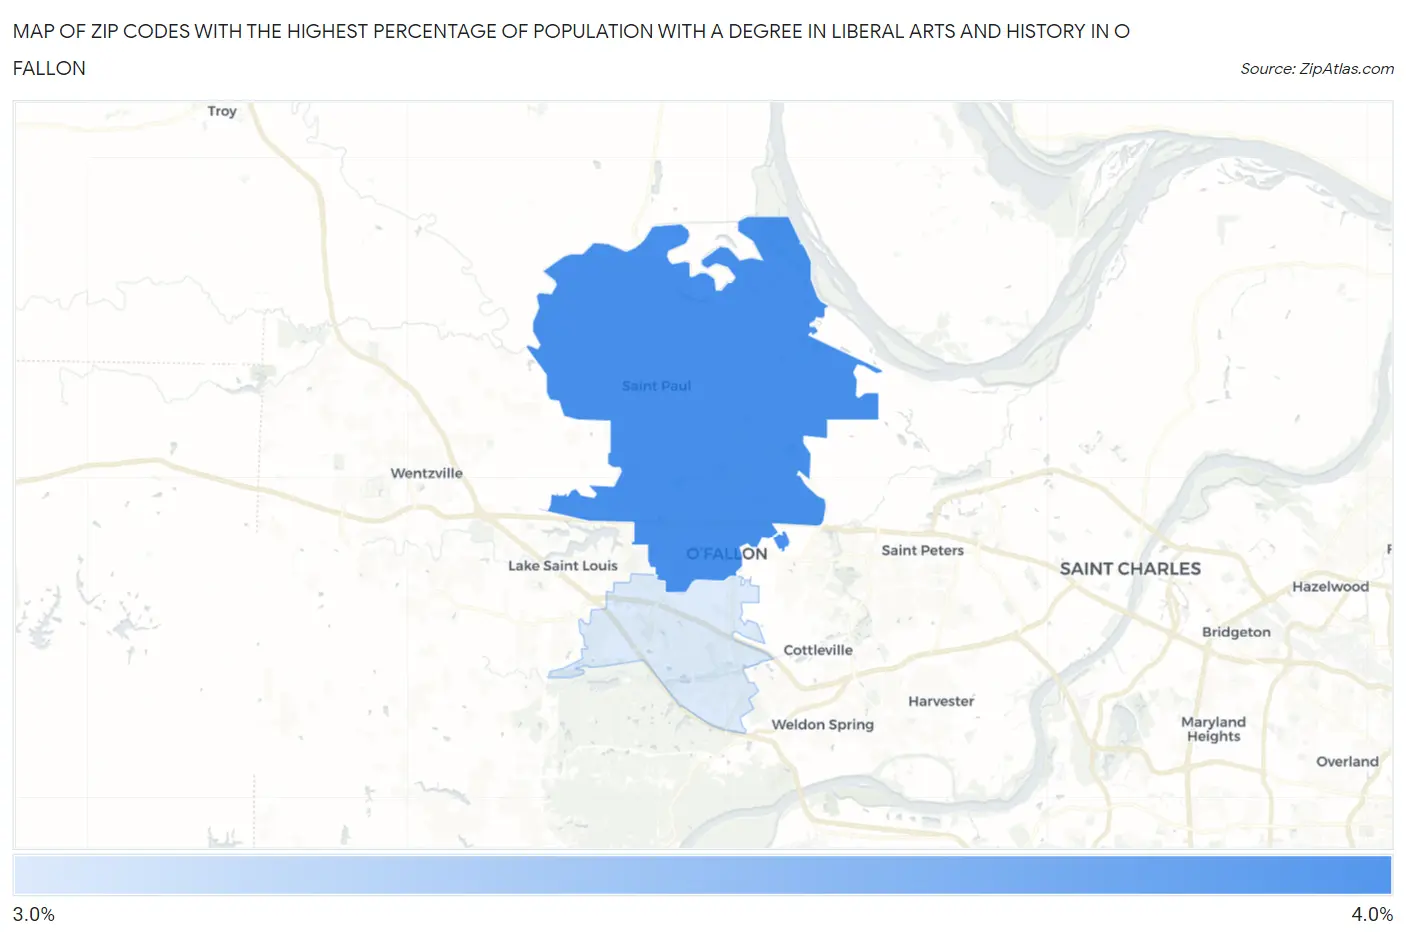
Map of Zip Codes with the Highest Percentage of Population with a Degree in Liberal Arts and History in O Fallon
3.2%
3.5%
Zip Codes with the Highest Percentage of Population with a Degree in Liberal Arts and History in O Fallon, MO
| Zip Code | % Graduates | vs State | vs National | |
| 1. | 63366 | 3.5% | 4.6%(-1.11)#432 | 4.9%(-1.42)#16,761 |
| 2. | 63368 | 3.2% | 4.6%(-1.36)#455 | 4.9%(-1.66)#17,617 |
1
Common Questions
What are the Top Zip Codes with the Highest Percentage of Population with a Degree in Liberal Arts and History in O Fallon, MO?
Top Zip Codes with the Highest Percentage of Population with a Degree in Liberal Arts and History in O Fallon, MO are:
What zip code has the Highest Percentage of Population with a Degree in Liberal Arts and History in O Fallon, MO?
63366 has the Highest Percentage of Population with a Degree in Liberal Arts and History in O Fallon, MO with 3.5%.
What is the Percentage of Population with a Degree in Liberal Arts and History in O Fallon, MO?
Percentage of Population with a Degree in Liberal Arts and History in O Fallon is 3.3%.
What is the Percentage of Population with a Degree in Liberal Arts and History in Missouri?
Percentage of Population with a Degree in Liberal Arts and History in Missouri is 4.6%.
What is the Percentage of Population with a Degree in Liberal Arts and History in the United States?
Percentage of Population with a Degree in Liberal Arts and History in the United States is 4.9%.