Zip Codes with the Highest Percentage of Population Employed in Production in O Fallon, MO
RELATED REPORTS & OPTIONS
Production
O Fallon
Compare Zip Codes
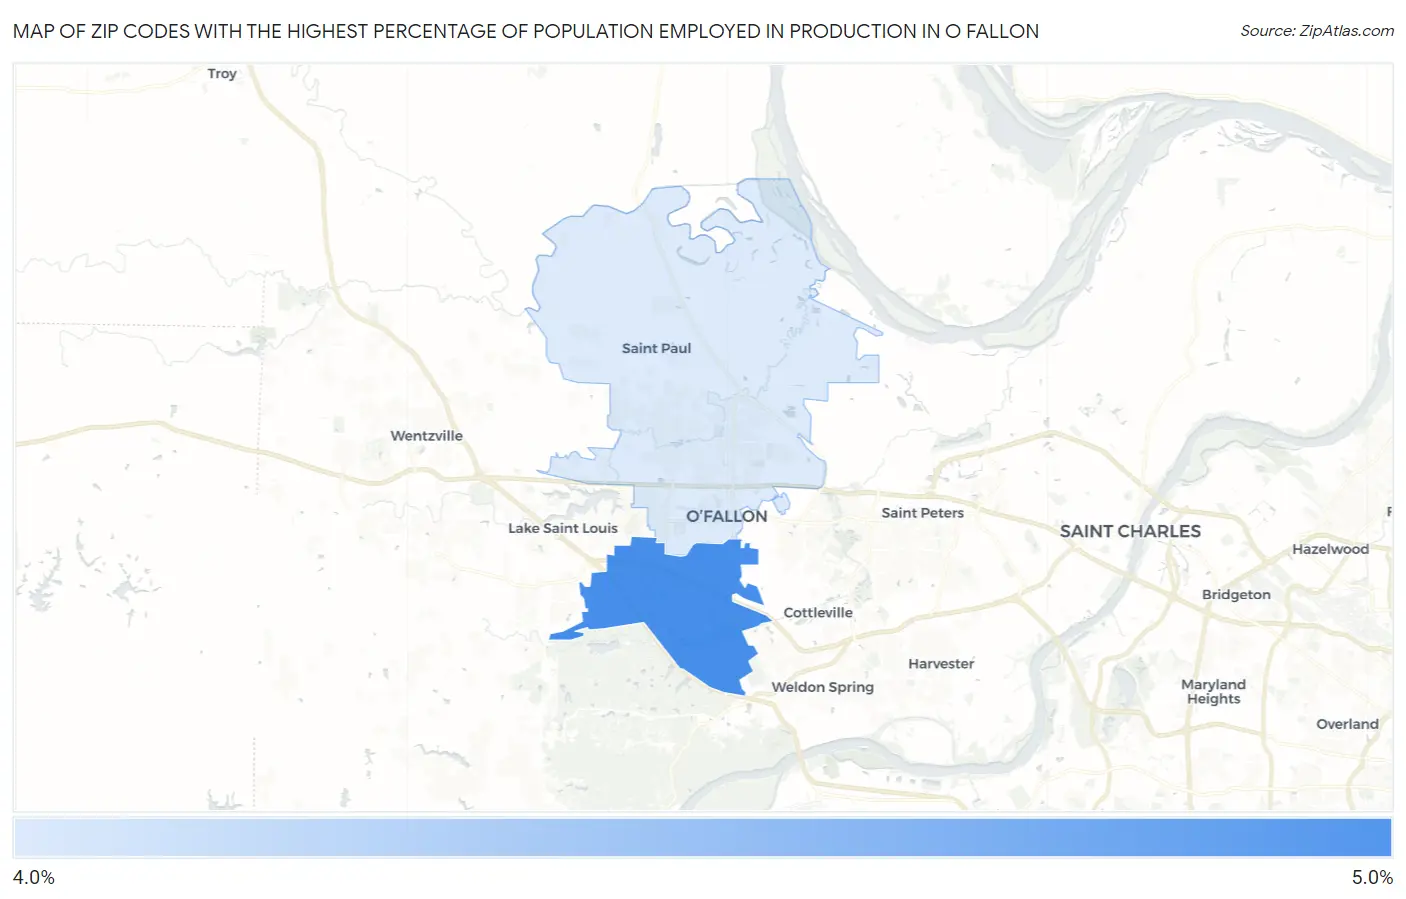
Map of Zip Codes with the Highest Percentage of Population Employed in Production in O Fallon
4.2%
4.3%
Zip Codes with the Highest Percentage of Population Employed in Production in O Fallon, MO
| Zip Code | % Employed | vs State | vs National | |
| 1. | 63368 | 4.3% | 6.6%(-2.31)#763 | 5.5%(-1.19)#19,625 |
| 2. | 63366 | 4.2% | 6.6%(-2.36)#768 | 5.5%(-1.24)#19,739 |
1
Common Questions
What are the Top Zip Codes with the Highest Percentage of Population Employed in Production in O Fallon, MO?
Top Zip Codes with the Highest Percentage of Population Employed in Production in O Fallon, MO are:
What zip code has the Highest Percentage of Population Employed in Production in O Fallon, MO?
63368 has the Highest Percentage of Population Employed in Production in O Fallon, MO with 4.3%.
What is the Percentage of Population Employed in Production in O Fallon, MO?
Percentage of Population Employed in Production in O Fallon is 4.2%.
What is the Percentage of Population Employed in Production in Missouri?
Percentage of Population Employed in Production in Missouri is 6.6%.
What is the Percentage of Population Employed in Production in the United States?
Percentage of Population Employed in Production in the United States is 5.5%.